Goal: To map the infrastructure assets available for new 5G equipment and track the permitting for these assets.
Datasets: Multiple city datasets, including new street light data and legacy infrastructure data.
On September 27, 2019, the Federal Communications Commission (FCC) issued rule FCC-18-133 to accelerate wireless and wireline broadband deployment. The FCC wanted to “remove regulatory barriers that inhibit the deployment of infrastructure necessary for 5G and other advanced wireless services.” Primarily, cities and municipalities had to make their infrastructure assets available for new 5G equipment. Permitting for these assets had to be assessed and then awarded or declined within 60 to 90 days. So how does a city prepare for and fulfill this ruling? For Scott Daeschner, the Enterprise GIS Manager for the City of San Diego, the answer is simple: map it.
Daeschner came to GIS in San Diego by way of seagrass in south Florida. Originally trained as a biologist, Daeschner worked for the Florida Marine Science Institute studying seagrass conservation and restoration. He found that it was difficult to do large-scale work with only a small team, so he started to investigate how GIS could help them. At first self-taught, Daeschner matriculated in a remote sensing program and started a learning lab in Florida. He moved west and completed post-grad work at San Diego State, and originally worked for the city on a project to optimize garbage routes. That program saved the city nearly $2 million a year for the first five years.
The success of that program helped further the GIS work in San Diego, work that the city has been invested in for the past thirty years. However, it wasn’t until five years ago that there was a formal GIS manager within the Department of Information Technology (IT). Previously, there were vendors and subcontractors, but this system meant that the approach to GIS was siloed among different departments and only contracts were centralized. Now, Daeschner oversees three staff who manage contracts, geo-enablement, mapping interfaces, and spatial analytics. Which brings us back to the issue of 5G infrastructure assets. What better way to organize and visualize this process than through a map?
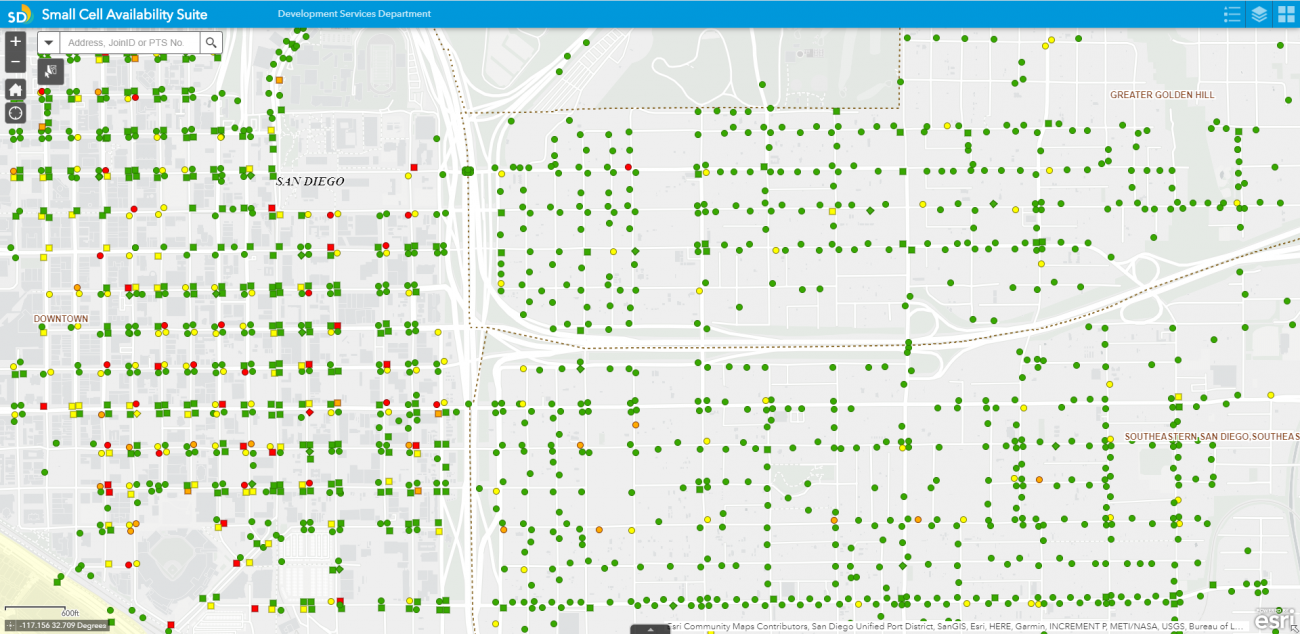
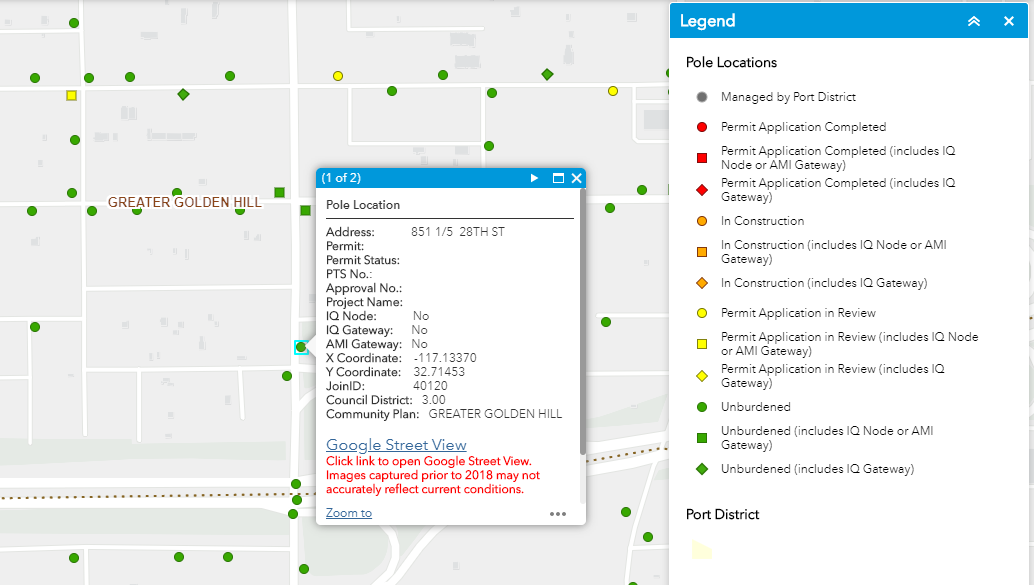
Daeschner and his team used the WebAppBuilder from ESRI to make an internal, interactive mapping interface that used red and green markers to identify which street lights are allowable and available for mounting 5G equipment. They also built a dashboard to track which lights were submitted, plus an external public interface, so telecommunications vendors could request permits for specific assets. This GIS reservation system allowed companies to look at the map and put in a reservation for a certain pole, then dynamically track their permitting. Finally, a mobile editing app performed quality assessment of the proposed locations. Only central employees can access the data and apps. Data and applications are secured and access roles are administered centrally. The city’s IT department supported the Development Services Department (DSD), to make sure that equity and transparency where highlighted in the process. This was especially important because permitting the 5G assets touched upon urban planning, public safety, and compliance monitoring.
The apps and tools also helped enhance the city’s legacy data, since Daeschner’s team had to reconcile multiple datasets to create the initial map. In order to identify the available space, sixty thousand street light locations were combined with “approximately four thousand mounted IQ sensor node, CCTV cameras, emergency response shot spotters, automated meter infrastructure gateways, existing small cells, and traffic signals.” This provided benefits beyond the 5G map; it improved the accuracy and robustness of the city’s infrastructure data, plus created a significantly more efficient permitting model.
Street lights are coded as available for permitting (green), already permitted or otherwise encumbered (red) and pending (yellow).
The public can now track equipment in their communities, the vendors can efficiently locate and request light poles, and city staff can quickly and easily monitor requests. Daeschner and his team found “unexpectedly high” adoption rates, indicating support for this type of coordinated data visualization and spatial analytics. Other departments who have seen this success expressed interest in using similar technology for their work.
Daeschner extolled the virtues of GIS in government, stating that “most municipal decisions have some kind of spatial component.” People have an inherent ability to understand spatial analytics through maps, and once they can visualize something they can understand how it impacts them. As most people are familiar with mapping due to things like Google Maps and in-car GPS, GIS can be a great tool for civic engagement.
Adopting GIS can also be an opportunity for collaboration. Daeschner is part of the San Diego Regional Council, since many of the GIS projects extend beyond the city limits. They often work together as a group for procurement, with those who have greater resources working with those who are more fiscally constrained. One of Daeschner’s recommendations for internal collaboration is to “avoid the term centralization.” Other departments may be hesitant to cede control or fear that their most technically-savvy employees will be annexed by central IT. Daeschner suggests a hybridized centralization model, where those employees are retained in their specific department, but work with Daeschner’s staff and rely on their expertise.
Under Daeschner’s leadership, San Diego’s work on GIS mapping was recently recognized by ESRI, winning one of the 2019 Special Achievement in GIS awards. The 5G applications and maps helped “set new precedents throughout the GIS community” and Daeschner hopes that San Diego can continue to lead local government innovation in the field.
About the Author
Betsy Gardner
Betsy Gardner is the editor of Data-Smart City Solutions and the producer of the Data-Smart City Pod. Prior to this, Betsy worked in a variety of roles in higher education, focusing on deconstructing racial and gender inequality through research, writing, and facilitation. She also researched government spending and transparency at the Lincoln Institute of Land Policy. Betsy holds a master’s degree in Urban and Regional Policy from Northeastern University, a bachelor’s degree in Art History from Boston University, and a graduate certificate in Digital Storytelling from the Harvard Extension School.