In 2017, more than 40,000 people in America died due to traffic crashes. Total fatal vehicle crashes have fluctuated annually over the last several decades going as low as 29,867 in 2011 as Americans limited their travel post-Great Recession, and as high as 40,327 in 2016 as more cars were back on the road as the economy recovered.
While total fatal traffic crashes have remained relatively stagnant since 1990, the total number of registered vehicles on the road has increased by nearly 80 million in that time frame. More cars on the road would normally increase the risk of death by traffic accidents, but one reason this has not occurred is that vehicle safety has improved significantly. Unfortunately, any improvements in vehicle safety have done nothing to protect innocent pedestrians on the street. 2016 and 2017 saw the two highest pedestrian death totals in the last 27 years, with 5,977 and 6,080, respectively. Experts at the National Highway Traffic Safety Administration (NHTSA) blame higher pedestrian death totals on increased incidences of impaired and distracted driving.
Transportation planners and local governments across the country are working to drive down total fatal traffic crashes through programs like Complete Streets and Vision Zero. These programs aim to redesign city streets to make them safer for travelers regardless of their mode of transportation. The eventual goal is to eliminate traffic fatalities.
Vision Zero Los Angeles
Every year in Los Angeles (LA), more than 200 people die and more than 950 sustain severe injuries in more than 30,000 traffic crashes. This places LA ahead of all other major metropolitan areas in the US as the leader in traffic fatalities per capita at 6.3 per 100,000. Additionally, 50 percent of those killed in traffic crashes in LA are pedestrians (44 percent) and bicyclists (6 percent), despite being involved in only 8 and 6 percent of all crashes, respectively.
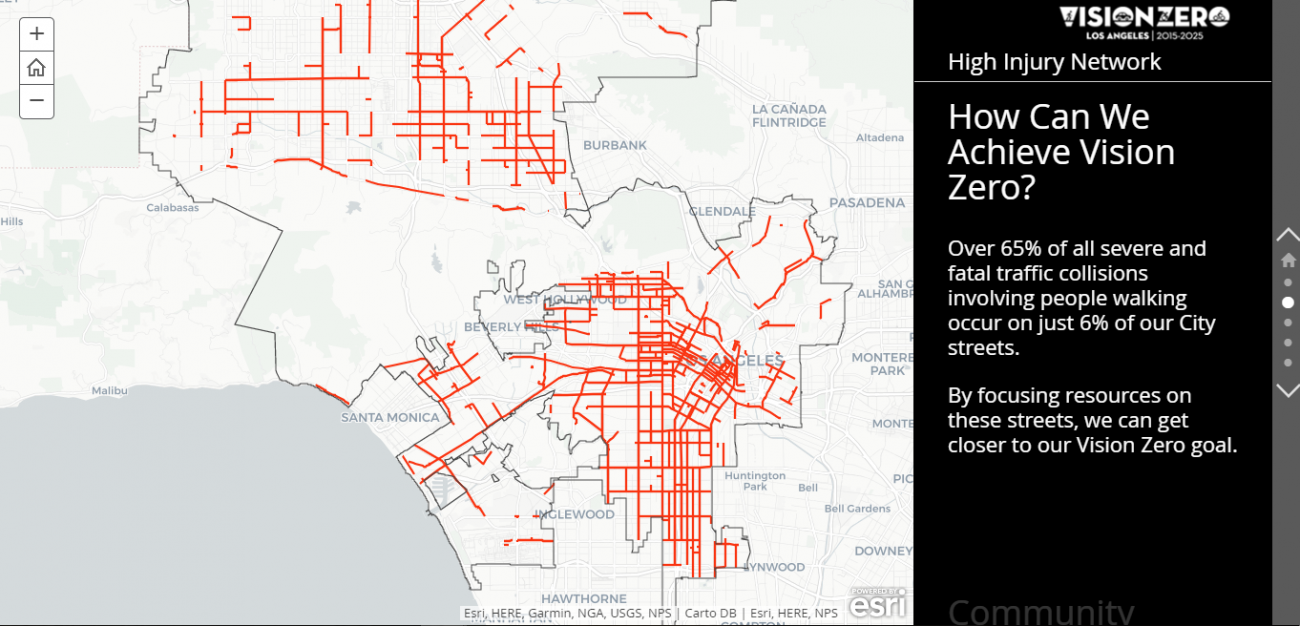
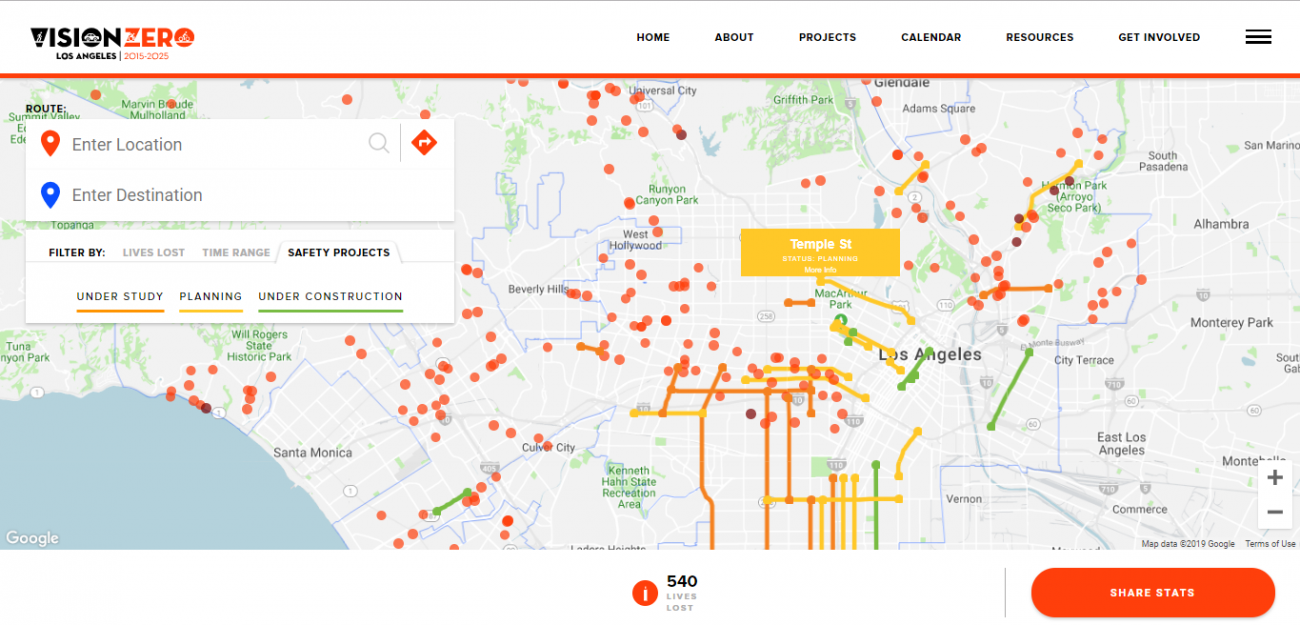
This data tells LA officials important information about the people who are impacted by traffic crashes, as well as how victims are killed. However, this information alone is not sufficient to address the concern of a city of 472 square miles, four million people, and 7,500 centerline miles of road. To eliminate traffic fatalities, LA officials needed to know what streets were most dangerous and why, particularly for those who walk or use bicycles. To do this, they developed the High Injury Network (HIN), a map highlighting city streets with the highest frequencies of severe injuries and deaths. Using this map, they discovered that 65 percent of severe injuries and deaths occurred on just 6 percent of LA’s streets. This information, which is presented in the map below, helped city planners prioritize street safety construction projects by identifying the city’s most dangerous roads.
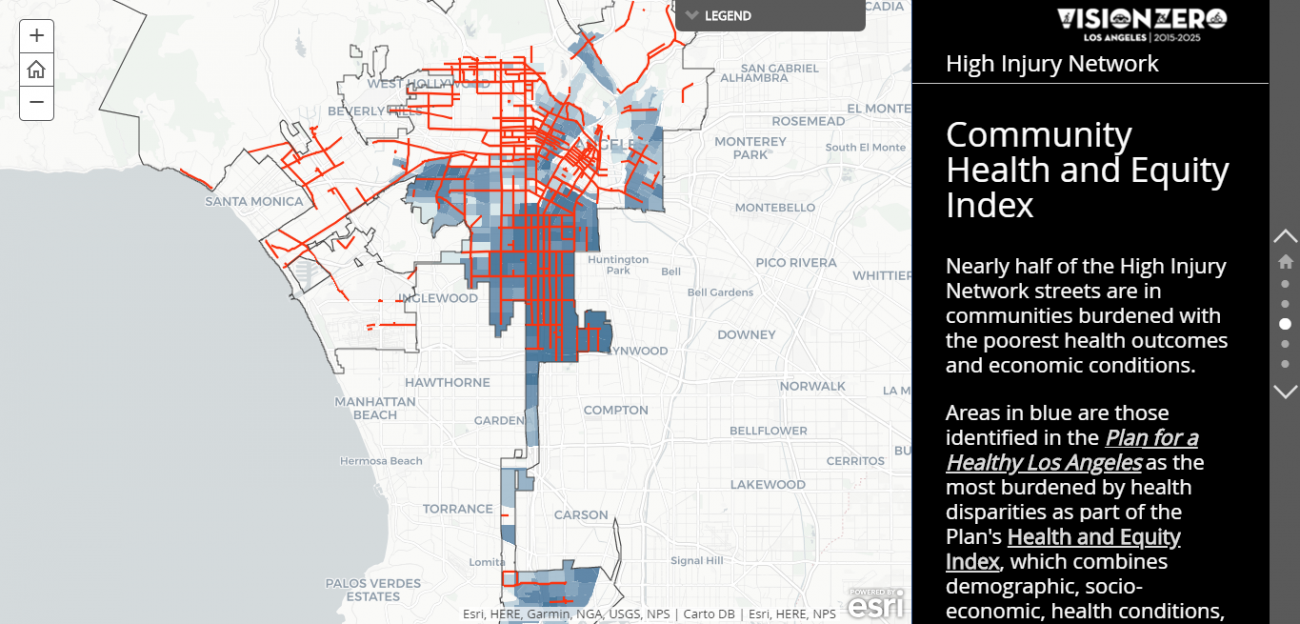
Beyond HIN streets, city planners wanted to see if neighborhoods with higher health disparities were also disproportionately impacted by higher rates of traffic deaths and injuries. To do this, they overlaid data from the Plan for a Healthy Los Angeles to see if communities facing higher health disparities were at higher risk of severe injuries or death by traffic accidents. As shown in the map below, they discovered that over 50 percent of HIN streets were in higher health disparity neighborhoods.
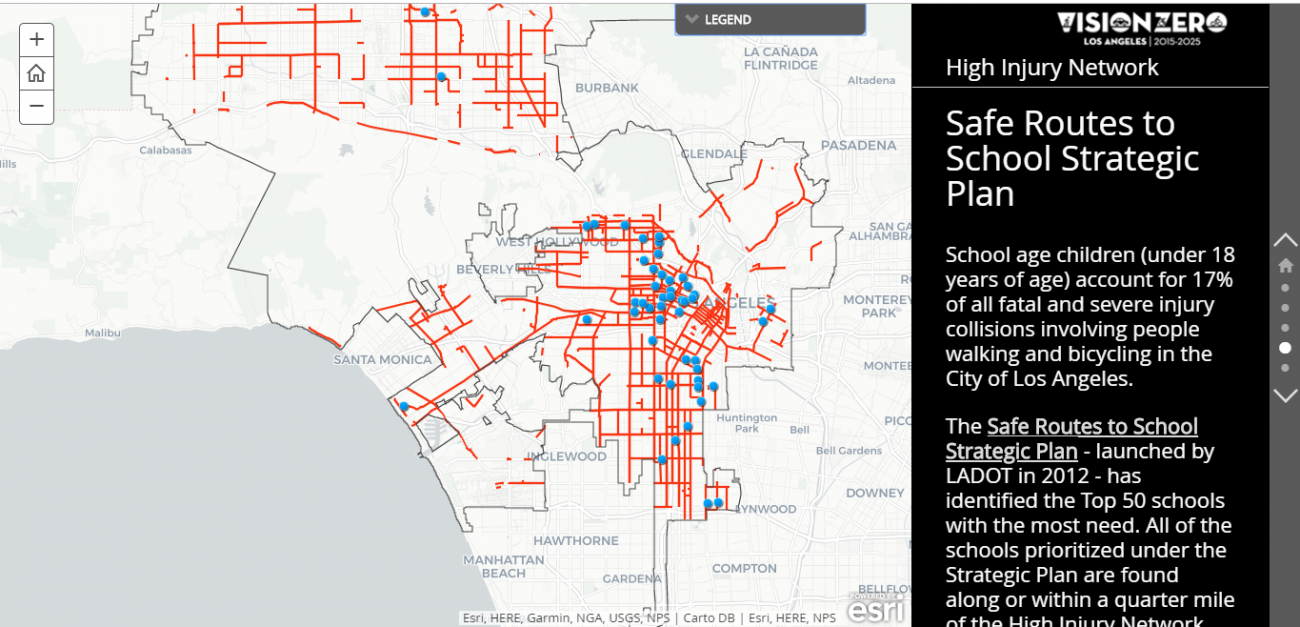
Another priority for LA is safer walks to school for children, so city planners then incorporated data from the Safe Routes to School Strategic Plan. This data revealed that all 50 schools identified within the strategic plan as having the highest need for intervention fall on or within a quarter mile of HIN streets.
This combination of HIN streets, health disparities, and dangerous routes to school collectively led to the prioritization of street safety construction projects throughout the city. To realize the Vision Zero dream, planners in LA now had the critical information they needed to create a plan to end traffic fatalities by 2025.
Reducing Traffic Fatalities: Beyond the Numbers
It’s easy to get lost in the numbers when it comes to improving traffic safety. While acknowledging that far more work is to be done, NHTSA experts were cautiously optimistic for progress after traffic fatalities went down one percent from 2016 to 2017 as vehicle miles traveled went up. If not personally impacted by a fatal accident, however, we might not fully realize the widespread impact when even one individual loses their life unexpectedly. Families of these victims certainly do not see their loved ones as just another statistic and it’s unlikely they perceive minor improvements like a one percent reduction in fatal traffic crashes as meaningful progress.
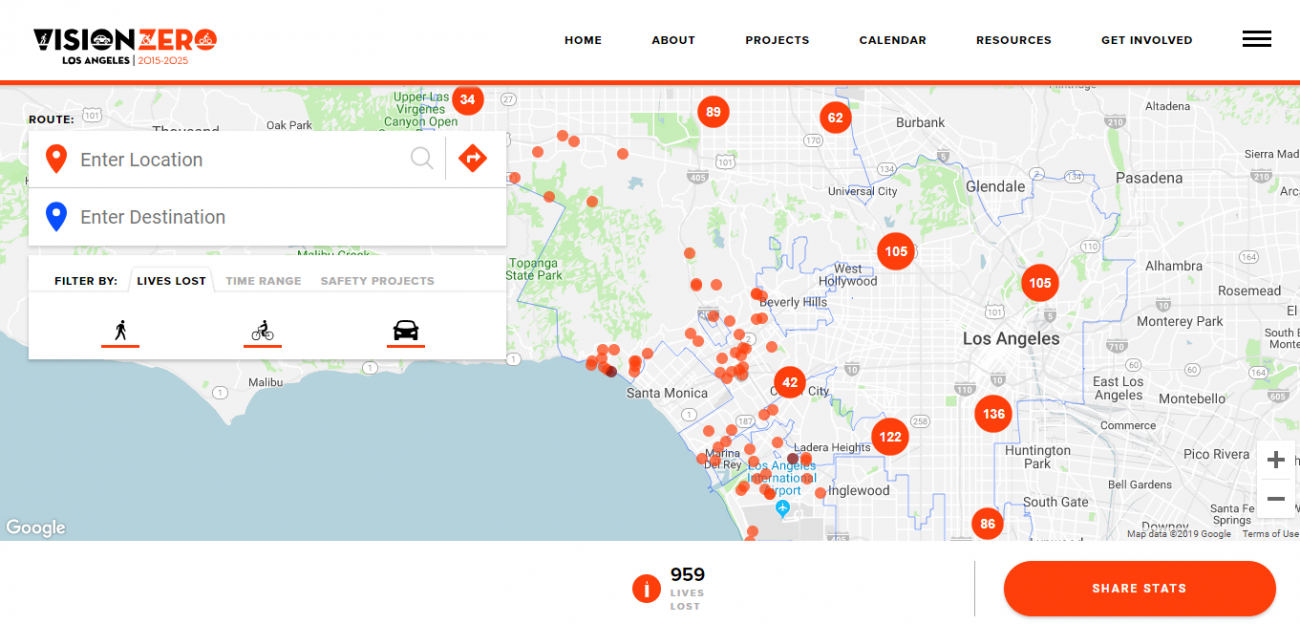
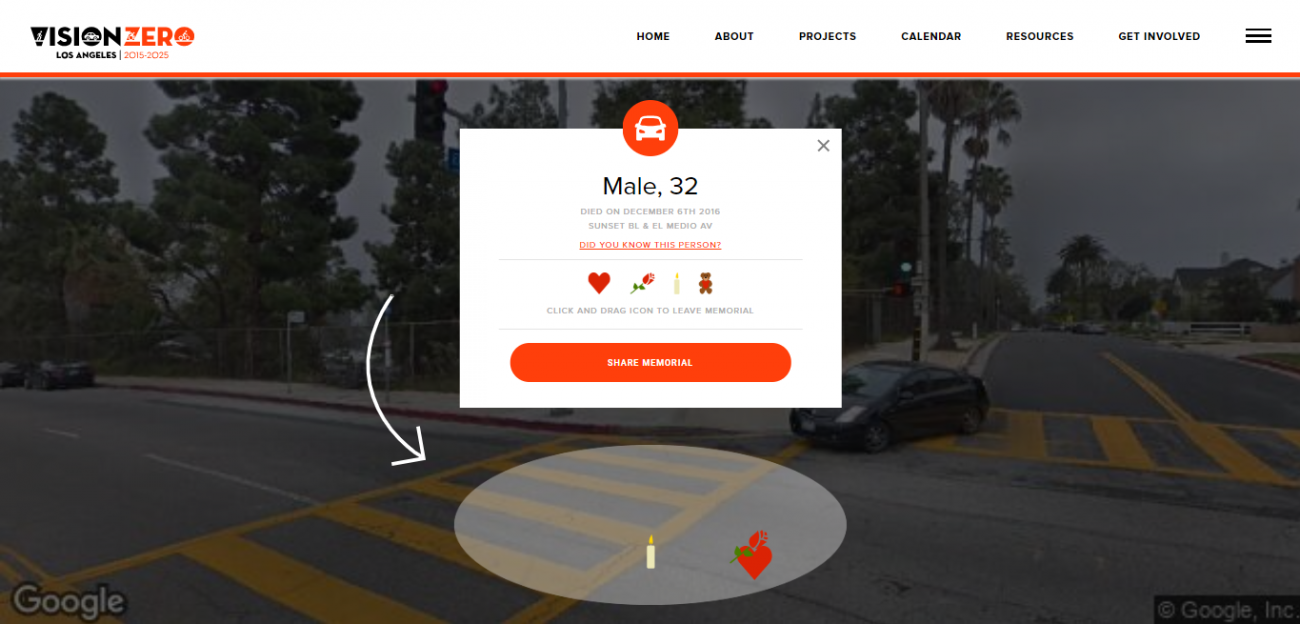
Planners in Los Angeles working to make Vision Zero a reality in their city understood that there are stories behind the lives of those who die in these crashes. As part of their efforts, they made sure that victims’ stories were told as they worked to transform city streets and prevent anyone else from suffering the same fate. To make this possible, Vision Zero planners created the following map which highlights not only the exact locations of where people have died in traffic crashes, but also describes a little bit about who the victims were including their age, gender and how they died. Those exploring the map can see where people died while traveling on foot, bicycle or in vehicles dating back to 2003.
If you click on an individual dot on the map, there is an option to “View Memorial” which brings the user to a Google Street view of the exact location where that individual lost his or her life.
Once there, users can leave a heart, rose, candle or teddy bear in memory of the person who died. Users can then share the memorial on social media to spread awareness about areas where traffic crashes have taken a person’s life.
This interactive map is perhaps more powerful than the data presented in the HIN map because it goes beyond the numbers and sends a powerful message to citizens about the unintended consequences of mistakes made behind the wheel. Another influential feature of the map is the display of street safety projects under study, planning and construction in areas where victims’ lives ended. It’s a direct message from city government to the victims (and their loved ones) that the city cares and is doing everything it can to make sure this does not happen to anyone else.
To continue to populate the map and tell this story, the LA Vision Zero team has partnered with Southern California Families for Safe Streets, a coalition of survivors of serious injury and fatal crashes, to help engage the families and friends of the city’s crash victims.
Working with local families and non-profits to memorialize victims is part of a renewed community engagement effort for the Vision Zero efforts. In the coming months, LA Vision Zero will release a new website with additional interactive maps. Stakeholders can participate in project planning by dropping a pin on the map and providing input on street safety issues they have encountered at that location. Users will be able to select from a drop-down menu to identify potential hazards (i.e., Dangerous Left Turn, Red Light Running, etc.), signage requests or issues (i.e., Stop Sign), as well as maintenance and transit requests (i.e., Lack of Bus Shelter or Bench) they may have within a Vision Zero focus area. To add more details, residents can add suggestions or notes in a comment box or attach images. A companion map will provide more details and explanations regarding street safety and construction projects to educate LA residents on how each project will ultimately help achieve the Vision Zero goals.
These mapping tools serve to tell the story of a city’s traffic safety crisis and the human impact of a roadway system that was originally built for speed instead of safety. They also tell the story of how the city and its residents are fighting to change the system and save lives.
About the Author
Matthew Leger
Matt Leger is a Research Assistant for the Innovations in Government Program at the Ash Center. He has a diversity of experiences in research across the public and private sectors, as well as in academia with a primary focus on understanding how technology can be used to help address some of society’s greatest challenges. Matt has worked with the Smart Cities Strategies team at the International Data Corporation (IDC); the NYCx team in the NYC Mayor’s Office of the Chief Technology Officer; and at the research institute CTG-UAlbany. He holds a Bachelor of Arts in Public Policy and a Master’s Degree in Public Administration both from the Nelson A. Rockefeller College of Public Affairs and Policy at the University at Albany in Albany, NY.