Goal: To both assist first responders in San Jose to reach out to residents in need during power outages in wildfire season, and allow residents to communicate with city officials about which areas in the city have power.
Datasets: Various datasets from San Jose’s Spatial Data Repository, data feeds from several San Jose data systems, Internal customer information from PG&E, data collected from San Jose residents during power outages via online surveys
In 2018, California experienced its deadliest and most destructive wildfire season ever recorded in history. By the end of the season, fires in Carr, Mendocino, Woolsey, the deadly Camp fire and several others burned over one million acres of land, resulting in the state spending hundreds of millions of dollars on fire operations. Furthermore, West Coast power company Pacific Gas & Electric Company (PG&E) was on the brink of bankruptcy by the end of 2018 and highly criticized when many of the fires from the past few years were found to have been caused by or directly linked to PG&E equipment.
With climate change making wildfires an ever-increasing concern, especially in California, PG&E wanted to be more proactive in 2019 and announced in the summer that it would be implementing preemptive public safety power shutoffs (PSPS) throughout California in order to reduce or eliminate the number of fires caused by their equipment. While an answer to one issue, these power shutoffs presented a whole slew of other issues for impacted cities to deal with.
One such city, San Jose, decided to take matters into its own hands and create new geographic information system (GIS) tools to guide their community response. These tools both assisted first responders in helping residents in need during PSPS incidents, presented outage status to the public, and allowed residents to report areas where there were power outages to the city.
This responsibility fell into the hands of Matt Loesch, the Assistant Director of Public Works in San Jose, and his staff.
“We had planned for: How do we provide our services and what will happen with our services when power is shut off in San Jose?” explained Loesch. “Public works is a strategic support department, meaning we’re supporting the frontline staff in making sure the cops and firefighters get to where they need to serve, or that our community centers are stood up and ready to go.”
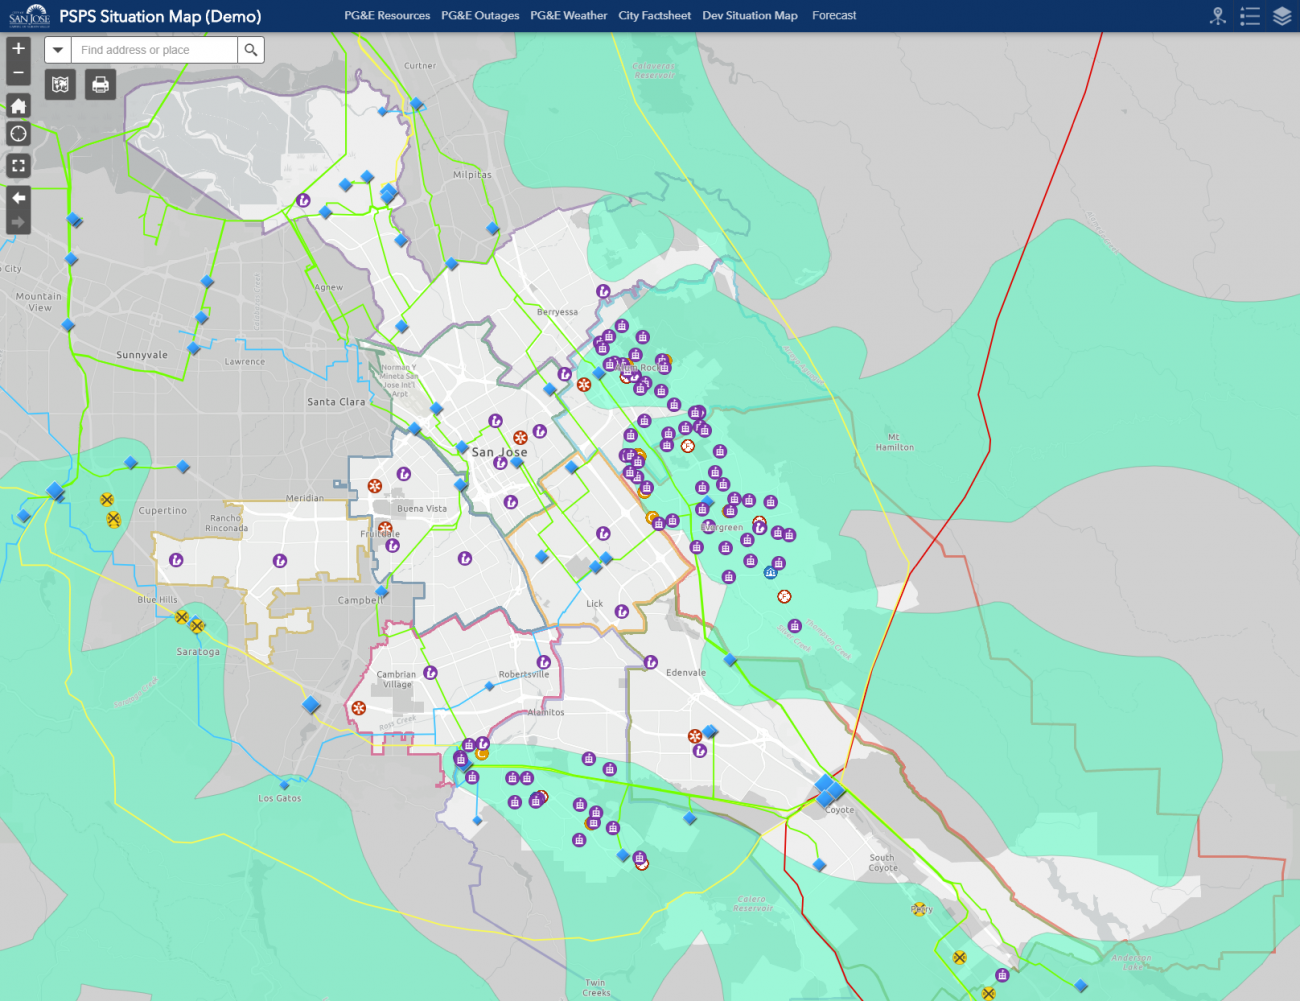
The Department of Public Works (DPW) received a list of critical facilities for the city, including storm pump and sanitary sewer pump stations, firehouses, and community centers that all would need fuel during a power shutoff. Yet, Loesch realized a challenge right away. “Lists aren’t really great when you’re doing this kind of work because you need to see where they are. Obviously, maps help you visualize lists, especially when they get complicated,” said Loesch.
Because San Jose’s DPW specializes in spatial data and applications and supports the Emergency Operation Center (EOC) staff during emergencies, the department built out a GIS map called the PSPS Situation Map and its public twin, the Public PSPS Situation Viewer. The map contains the city and district boundaries, as well as critical facilities, contained in different layers that can be added or swapped out as needed for emergency operations, community outreach, or media purposes.
The PSPS maps were informed by information PG&E gave to the city projecting the areas where power outages were predicted to happen. Those areas visualized on a GIS map are called polygons. By layering this with the city’s data, Loesch’s team is able to visualize what areas with critical facilities will be impacted by power outages.
“We have a polygon that comes in, that grabs from the datasets that we load in, and can then give us the ability to see projected outage of critical facilities, so we could pre-position equipment and services. We have a huge population of people that come and go out of this area. We have an important freeway used by residents and businesses to and from the power impacted areas. What happens when people get off that freeway and all the traffic signals are off?” said Loesch. “We are pre-positioning and thinking through those operations, but we had to be able to project that and show that to our Department of Transportation—those providing frontline service of blocking streets, so they can use this information to pre-plan.”
These features additionally helped Loesch’s staff locate and identify impacted rail crossings or particular pump stations and determine whether it’s a municipal water station or a sanitary sewer pump, whether there is a generator, and fueling statuses—all important details during an emergency like a power shutoff. Each facet of San Jose’s critical facilities (pump stations, community centers, fire houses, traffic signals, radio towers, hospitals, schools, generators, etc.) is embedded into a different layer that can be individualized based on a city employee’s need to do their work that day.
In addition to preparing city operations for power shutoffs, San Jose also wanted to make sure residents—especially those with medical needs—were prepared, informed, and able to get help if needed. PG&E provided Loesch’s team with medical baseline data for San Jose’s residents. (Medical baselines are PG&E’s specialized lower power rates customers are able to apply for if they have certain medical conditions that need power on a regular basis, such as respirators or CPAP machines.) With that information, Loesch and his team were able to add another layer to the PSPS map identifying where vulnerable and older residents in San Jose who could have more severe issues if their power were shut off were located. Then, the Liaison Branch of the Emergency Operations Center began working on outreach.”The City staffed eight to ten people that sat in a room and literally called every single one of these people, and sought if they had needs, or if they needed help, or if they were okay, and whether they have medical support that they need.”
With a situation like this, there was only so much pre-planning San Jose was able to do. “We had a team of GIS staff whose whole mission there was, ‘Get these polygons right,’” said Loesch. “Once the power shutoff actually starts happening, then the challenge becomes, how do you then refine the polygons to the real area that's impacted?”
Loesch and his team were able to utilize the large population in San Jose (1 million people) to help provide city officials with real-time information from impacted areas. After discarding ideas such as having residents report shut off areas by Tweeting because of accessibility barriers, Loesch’s staff generated a browser based survey application during the first outage in early October that could be used on any device and had residents simply answer whether they had power or not. That information then populated the dashboard Loech’s team created, which could also list the type of comments received from residents.
“We would use those report dots on the map, to again, refine those polygons because that's what we were focused on. How do we get information to change the polygons quickly? Because there are potential information holes out where we need to have services for both fuel, and where we could be concerned about power being out for schools or whatnot,” said Loesch.
The ability to update quickly and work as an agile tool was an important aspect of the PSPS Situation Map. “The great thing about this survey platform is our staff literally could type it in, hit save, you would refresh it, and it's live. There's no download of anything. It's just whenever they pull it up, there is updated information,” said Loesch.
Neil Rufino, the Mass Care Coordinator in San Jose’s Emergency Operation Center, utilized these maps for the first time during the power outages in the Bay Area in the fall. His job entailed the important step of an additional level of direct communication to the residents, meaning Rufino was in charge of doing follow-up outreach to individual households on information about the power shutoff.
“We were utilizing the information that Matt and his team was providing for us, in terms of which households we felt weren’t contacted within the impact zone. We grabbed the address from a file and we were able to start getting them out to our staff,” explained Rufino.
With the new tools, Rufino said the ability for his staff to achieve their outreach mandates was vastly improved. “The knowledge of being able to easily see how far, in terms of miles in between where the neighborhoods were, really helps us in terms of outreach strategy—to be able to understand how we can deploy our staff. We have visuals to be able to see it all, from the top of the city to the bottom of the city,” explained Rufino. “The benefit for us is to #1, have the accurate addresses and #2, for us to have it on maps so we could figure out a good geographic spread for drivers.”
Despite the chaos that PG&E’s power shut offs caused in California, Loesch and his team in San Jose were able to make sure they were one step ahead of the curve in both helping residents and making sure their emergency services were running as smoothly and efficiently as possible.
“Really, I have two missions,” said Loesch. “I want to project our readiness, and show how we are collectively supporting, being extremely nimble.”
About the Author
Stefanie Le
Stefanie Le is a research assistant/writer at the Ash Center for Democratic Governance and Innovation. She previously worked at the Information Disorder Lab at the Shorenstein Center on Media, Politics and Public Policy, the International Criminal Court, and The Boston Globe. Stefanie holds two master’s degrees from the UC Berkeley Graduate School of Journalism (2018) and Harvard University (2016), where she specialized in international law and investigative reporting, and international relations respectively, and bachelor’s degrees in journalism and English literature from Emerson College.