Goal(s): Educate and engage community members in underserved neighborhoods about how to navigate political systems and advocate for change.
Datasets: Dolores Huerta Foundation data
Dolores Huerta, a long-time activist for farmers and minority communities in California, famously said that “every moment is an organizing opportunity, every person a potential activist, every minute a chance to change the world.” These words represent the founding principles of the Dolores Huerta Foundation (DHF) for Community Organizing, a 501c(3) non-profit in Bakersfield, California that she founded in 2002. Today, the organization’s Executive Director (ED) Camilla Chavez, the youngest daughter of Dolores, and her team are on a mission to engage, educate, and empower minority and underserved communities across San Joaquin Valley.
The power of community organizing is exemplified by the success of DHF in their use of maps to tell their collective stories to elected officials. According to Chavez, over the years Vecinos Unidos (“Neighbors United”), a group of volunteers from local communities with nine chapters in San Joaquin Valley (organized by DHF), have brought millions of dollars into their neighborhoods for infrastructure improvements. These include sidewalk and road repairs, as well as streetlight installations and sewer expansions. This kind of work began in DHF’s early days before they had the GIS capabilities they currently leverage. Back then, Chavez said she had “community members literally draw their neighborhoods showing those [infrastructure] gaps. We actually handed over hand-written maps to city officials.” Using those handwritten maps, Chavez and her team organized committees of Vecinos Unidos members by neighborhood and then they brought in the County Supervisor so each committee could present to him. You can explore the group’s “Victories Map” below to see where their work has had an immediate impact on area neighborhoods.
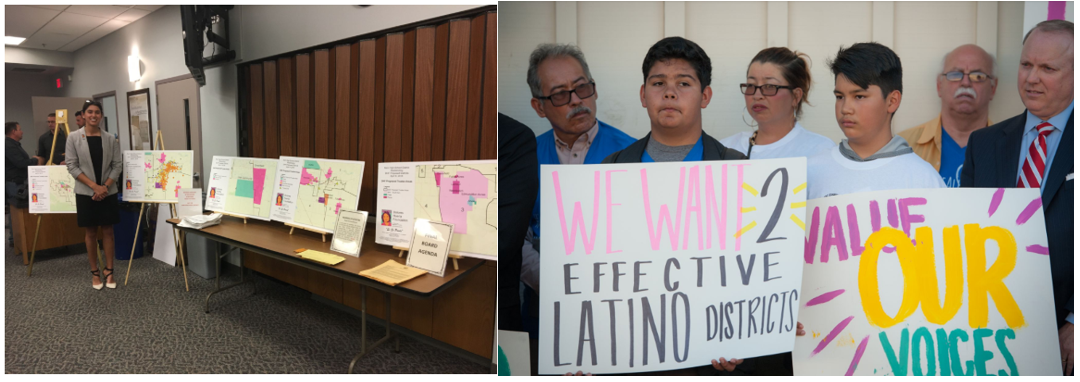
Today, DHF are using digital maps and data in their advocacy work and have expanded their reach to include efforts related to school district gerrymandering. In 2018, the organization was able to demonstrate how Kern County’s school district lines put members of the Latino and Sikh communities at a significant disadvantage, and favored the interests of the Trustees of the Board of Supervisors who were responsible for drawing the district’s lines. The following map helped visualize the lack of representation in the school districts.
Using these maps, DHF filed a major lawsuit against the Board of Supervisors. To build their case and support for the lawsuit, DHF held community meetings to educate the public about what gerrymandering was and how it was negatively impacting them. They also presented their maps on several multi-lingual media channels and even presented them at that year’s ESRI User Conference. Their message of “Is this really representation?” rallied many in the community. With the power of maps and the community behind them, DHF won the lawsuit.
From there, the county was forced to redraw their school district maps. As a result, two of five of these districts are now majority Latino for the first time ever, giving a Latino a serious chance to earn a seat on the county board and bring better representation in public education. They are also in the process of suing other school districts for gerrymandering as well.
Beyond gerrymandering, the group is also using maps to address issues related to public health, the 2020 census, and the school to prison pipeline. They have built up a network of over 20,000 community members who trust DHF enough to vote in local elections based on the information provided to them from the organization. Maps and data have been critical to creating a common understanding among members of the community about the challenges they face, and in energizing them to come together and be their own advocates.
Sophia Garcia, GIS Analyst at DHF said that we must come to an “understanding that in our society right now…. Disadvantaged groups may not be heard if they tried to communicate their concerns without a visual or data to back them up. We need to understand our audience and the limitations of their communication skills to make sure the message they want to convey truly gets across.” Moving forward, Chavez hopes to get more local youth exposed to GIS so that they understand how to use it and can bring their story to light through data visualization.
About the Author
Matthew Leger
Matt Leger is a Research Assistant for the Innovations in Government Program at the Ash Center. He has a diversity of experiences in research across the public and private sectors, as well as in academia with a primary focus on understanding how technology can be used to help address some of society’s greatest challenges. Matt has worked with the Smart Cities Strategies team at the International Data Corporation (IDC); the NYCx team in the NYC Mayor’s Office of the Chief Technology Officer; and at the research institute CTG-UAlbany. He holds a Bachelor of Arts in Public Policy and a Master’s Degree in Public Administration both from the Nelson A. Rockefeller College of Public Affairs and Policy at the University at Albany in Albany, NY.