The Birth of Gerrymandering
 When Elbridge Gerry finally won the Commonwealth of Massachusetts’ gubernatorial race in 1810 after four failed attempts to do so, he was eager to ensure his Democratic-Republican party would remain in power. In 1812, Governor Gerry signed a new plan into law that completely redrew senatorial district lines in Massachusetts to give his party the advantage in representation.
One of those districts included the towns of Salisbury, Amesbury, Haverhill, Methuen, Andover, Middleton, Lynnfield, Danvers, Lynn, Salem, and Governor Gerry’s hometown of Marblehead. Together in one senatorial district, the lines formed what kind of looked like a salamander. Elkanah Tisdale, a political cartoonist, recognized this and published this image in the Boston Gazette on March 26, 1812. Fittingly, the term “Gerrymander” was born.
Gerrymandering v. Redistricting
Every ten years, the US Census is conducted to track the US population. Using this information, every state redraws its voting districts to reflect the shift in population. The goal is to ensure that, based on population size in each district, voters are equally represented in state and federal government. This practice is known as “redistricting.” Unfortunately, majority parties in many states across the country abuse this power and redraw the lines to favor their political party. They can do this in two ways:
-
“Packing” opposition party voters into a few smaller districts, and
-
Splitting voting districts up so that the party that would normally have majority in a district have their population split in half, turning the majority in one district into the minority in two or more districts (otherwise known as “cracking”).
Ultimately, our elected officials are choosing us, not the other way around. This is gerrymandering and this is common practice even today.
How gerrymandering has been allowed to continue has a long, complicated history in the US court system. To better understand why the US Supreme Court has struggled to rule on partisan gerrymandering, watch this short explanation by Russell Wheeler, Visiting Fellow of the Brookings Institute.
The Supreme Court accepted one more case on partisan gerrymandering in 2019. Last week on June 27, all five conservative justices came together and ruled that the “courts lack the authority and competence to decide when politics has played too large a role in redistricting” and that “there is no legal standards discernible in the Constitution for making such judgements.”
The Evolution of Gerrymandering
The University of Richmond’s Digital Scholarship Lab (DSL), in partnership with Virginia Tech’s history department, worked together to map the last 200 years of redistricting in the US House of Representatives. Viewers can see the partisan shift in votes and can track how voting districts have been reshaped year over year.
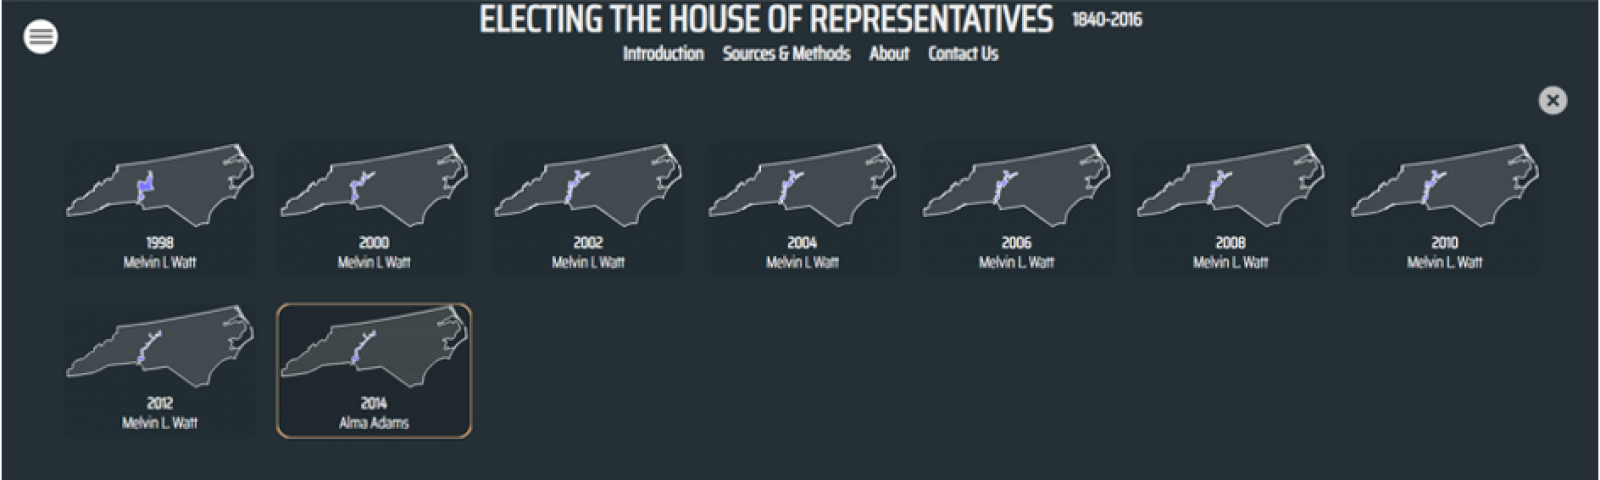
In 2014, Christopher Ingraham of the Washington Post analyzed every congressional district in the US to better understand the state of gerrymandering across the country. In the process he discovered some very surprising facts. Among them, he found that North Carolina’s 12th District was the single most gerrymandered district in the US. DSL’s map tracks the changes in this district over time, revealing that voters in this district have been squeezed into one very tiny, narrow district. Democrats have won every election since 1998 according to the snapshot below.
 In a competition that North Carolinians are likely not proud to be winning, Ingraham found that three of the 10 most gerrymandered districts were in their state. In the 2018 midterm elections, Republicans in the state received just over 50 percent of the votes but took 10 of 13 seats. North Carolina’s redistricted maps had been found to be unconstitutional by a panel of federal judges and was one of two cases (the other in Maryland) that were elevated to the Supreme Court. However, last week’s ruling that federal courts cannot intervene in partisan gerrymandering cases has effectively allowed gerrymandering to continue.
You can see the ten most gerrymandered districts in the US here. To see how gerrymandered your district is you can use Ingraham’s interactive map.
Some Solutions to Gerrymandering
Not all states allow their legislators to redraw voting districts. California and Arizona have independent commissions; New York, Connecticut and Iowa have advisory commissions; New Jersey, Washington, Idaho and Hawaii have a commission of political appointees; and Montana, Wyoming, North and South Dakota, Vermont, and Alaska only have one congressional seat and so no redistricting is necessary. The remaining 35 states allow their state legislators to redraw the lines as seen in the in the map below. To better understand what advisory commissions, political commissions, and independent commissions are please review the Brennan Center for Justice’s guide here. Ballotpedia provides a complete breakdown of how each state conducts redistricting and explains the federal requirements they must follow.

2018 Ballot Measures to End Gerrymandering
In the 2018 midterm elections, voters in Utah, Missouri, Colorado and Michigan were granted an opportunity to take redistricting responsibilities out of the hands of their state legislators.
Prop 4 in Utah passed by just 7,000 votes after initially being too close to call, giving redistricting responsibilities in the state to an independent commission appointed by the governor, and a legislative commission that will redraw state legislature voting districts. Missouri’s Amendment 1 passed with 60 percent of the vote, establishing a bipartisan committee that will vote on proposed maps drafted by a nonpartisan state demographer. With 70 percent of the vote, voters in Colorado overwhelming supported Amendments Y and Z establishing an independent commission that will oversee redistricting for state legislators and congressional seats after the 2020 census. In Michigan, Proposal 2 also passed, putting redistricting responsibilities into the hands of an independent redistricting commission. Federal judges in Michigan recently ruled that 30 of the state’s voting districts for the US House of Representatives and the state legislature were unconstitutional. Annie Lo’s article for the Brennan Center for Justice is an excellent resource on these ballot measures and other redistricting reform efforts in progress.
The Complexities of Redistricting
Across America, voters and other organizations are fighting to end partisan gerrymandering. However, what most voters likely do not realize is that finding a better alternative is rather difficult. As David Wasserman of the Gerrymandering Project notes, “It’s easy for opponents of gerrymandering to argue what districts should not look like.... But it is much more difficult to say what districts should look like.” He goes on to ask some critical questions like, “Should districts be drawn to be more compact? More conducive to competitive elections? More inclusive of underrepresented racial groups? Should they yield a mix of Democratic and Republican representatives that better matches the political makeup of the state? Could they even be drawn at random?” To see exactly how redistricting tailored to these priorities would play out in practice, Wasserman and his team mapped out the entire country with these questions in mind. Here are the results:

There is not one scenario here that does not favor one party over the other. In fact, in almost every scenario, Republicans end up with the majority of seats with the exception of “Democratic Gerrymandering” (for obvious reasons). Of course, the competitiveness map provides greater opportunity for either party to pull ahead of the other, but projections still show Republicans pulling ahead of Democrats in total seats (which, if that is the will of the people, then that is democracy at work). However, one important point to remember here is this map assumes no one will ever move or switch political parties which throws all of these scenarios for a loop in the real world, especially with everything going on today. With that, the question comes back full circle to “what should voting districts look like?”
There were two points Wasserman and his team were trying to make:
-
There is no perfect solution to gerrymandering
-
While no solution is perfect, the current system is definitely not the best.
To see how each scenario ranks in accordance with the redistricting priorities (including the current system), his team ranked each solution side by side:

No matter the answer, allegations of unfairness will surely arise from one side of the aisle or the other. As Wasserman has shown, there is no one solution that can make everyone happy. Because of this, the public is often caught in the middle of the partisan fight during a process they really have no say in and are often disconnected from. This process tends to only increase public distrust in government institutions, further adding to the complexity of finding the right answer.
Public Participation in Redistricting
Prior to getting stuck in limbo over Proposition 4 in Utah, the state legislature had previously taken an innovative approach to redistricting in the hopes of educating the public and giving them a chance to participate in the process. They deployed Esri’s Redistricting Tool to help.
The Utah State Legislature understood the complexities of finding better redistricting practices. They thought it would be valuable to help the public understand those complexities and encourage them to engage with their government to help find a solution. Citizens were able to go online and propose their own redistricting plans for congressional voting districts and state school board districts. They also had the ability to provide comments and share their ideas online if they were unable to attend any of the 17 public meetings being held throughout the state.
In addition to drafting up their own plans, citizens could share their maps with groups online where they could discuss and refine their ideas. When completed, citizens could take their redistricting plans, submit them to the Utah Joint Redistricting Committee and discuss them openly at public meetings where their findings could be debated.
The voters of Utah showed up to participate: one thousand people registered for the online Redistricting Tool; 323 submitted their redistricting plans with 271 fulfilling the requirements for completeness. Members of the media participated in the process as well.
With minor adjustments, the Utah state legislature adopted a redistricting plan for state school board districts. While they could not find a solution for Congressional voting districts using public input, the mapping tool created unprecedented opportunities for the public to educate themselves about the process and for the state legislature to earn some trust from their constituents. The following was a snapshot of a redistricting plan in Utah that met all federal requirements:

This process was still imperfect. At the end of the day, there was still disagreement about the final redistricting solutions. As noted by Rebecca Green of William & Marry Law School, open government processes like this leave public entities open to several additional challenges that can threaten the program’s success. Among them she notes that, “average citizens do not have the time or resources to monitor public officials themselves” and they must often rely on intermediaries to draw attention to government activity. Because of this, the public can be vulnerable to the agendas and often distorted messages of those intermediaries which can cause confusion and ultimately increase distrust. She also notes that “redistricting has traditionally been too arcane and complex a topic for most Americans to grasp… These complexities make it difficult for the public to meaningfully engage.”
Citizens and Politicians Can Work Together to End Partisan Gerrymandering
In writing for the majority in last week’s Supreme Court gerrymandering case, Chief Justice John Roberts alluded to States that are actively working to address partisan gerrymandering, suggesting that they (and their constituents) should be left alone to decide what is considered too partisan. While this may seem unfeasible given that it was the majority party in the state legislatures that drew the gerrymandered districts to begin with, Utah legislators have demonstrated positive steps toward working hand in hand with their constituents to draw fairer, more-representative district lines. With the federal government refusing to get involved, anti-gerrymandering activists are heading back to the drawing board and must now work harder to get everyday citizens involved in the fight for equal representation.