

- May 22, 2019
- Disaster Management
On April 29th Joko Widodo, the president of Indonesia, announced that Jakarta would no longer be the seat of national government. Although a new location has yet to be named, one major consideration for the new capital city is disaster risk. The National Development Planning Minister Bambang Brodjonegoro explained that “the new capital city should be located near the coast, but not necessarily by the sea” which will be a significantly different geography than Jakarta. In addition to over congestion and pollution, a major contributing factor for the move was the extreme flooding that has battered Jakarta and worsened in recent years. Climate change has caused increased rainfall and rising sea levels in the sinking city.
Closer to home, many cities in the U.S. are also struggling with extreme flood conditions due to major storms and elevating oceans. As climate change alters the geography of coastal and watershed areas, state and local governments are using data to help their constituents understand potential risks and make informed decisions about prevention. The role of data is especially important given that many more individuals live in flood zones than previously thought and FEMA has struggled to maintain accurate and reliable flood maps. Below are three examples of data mapping tools that governments and their partners have created to educate residents about flooding in high-risk areas.
The risk of land loss in Louisiana is extraordinarily high; 80% of the nation’s coastal land loss occurs in the state. In June 2017 Louisiana’s Coastal Protection and Restoration Authority published its Comprehensive Master Plan for a Sustainable Coast, which also introduced the Master Plan Data Viewer. Residents can use the interactive tool to visualize exactly how their community will be affected by various climate change and flooding scenarios over the next 50 years, and learn how to reduce their risk through steps like emergency planning, structural retrofitting, and storm proofing.
The data viewer is a comprehensive resource, linking out to additional flood maps, a guide to risk reduction funding, and a full data download page. It maps all the state projects from the Coastal Master Plan, updating the data so citizens can monitor progress and track accountability. The tool even depicts social vulnerability, using data from the 2010 U.S. Census and the 2009-2013 American Community Survey, to highlight potential community disparities for flood preparation and recovery. According to the published Master Plan, the modeling for this project was designed to “provide quantitative comparisons of options for action [and] is viewed across the world as a model for science-based coastal decision making.”

In Virginia, another area beset by persistent and worsening flooding, Dr. J. Derek Loftis and others at the William and Mary Virginia Institute of Marine Science (VIMS) are using community engagement and cross-sector collaboration to map and predict rising tides and flooding. The award-winning StormSense project integrates various data sources to predict flooding from storm surge, rain, and tides. In 2016 Loftis partnered with Newport News and other Hampton Roads coastal communities in Virginia, using grant funding from the National Institute of Science and Technology through the Replicable Smart City Technologies program. Knowing the dangers in sea level rise and coastal flooding, Loftis wanted a way to monitor changes in water levels and predict and prevent severe flooding. Working with a network of local governments, he attached smart sensors to bridges and other high risk areas to monitor water levels every six minutes, near real time. This data is displayed on both VIMS’s TideWatch Charts and on the StormSense portal. The water level sensors also integrate with other VIMS data, including sensors for wind speed, air pressure, rainfall, and water levels in order to most accurately forecast storms and warn regional residents about flooding dangers.
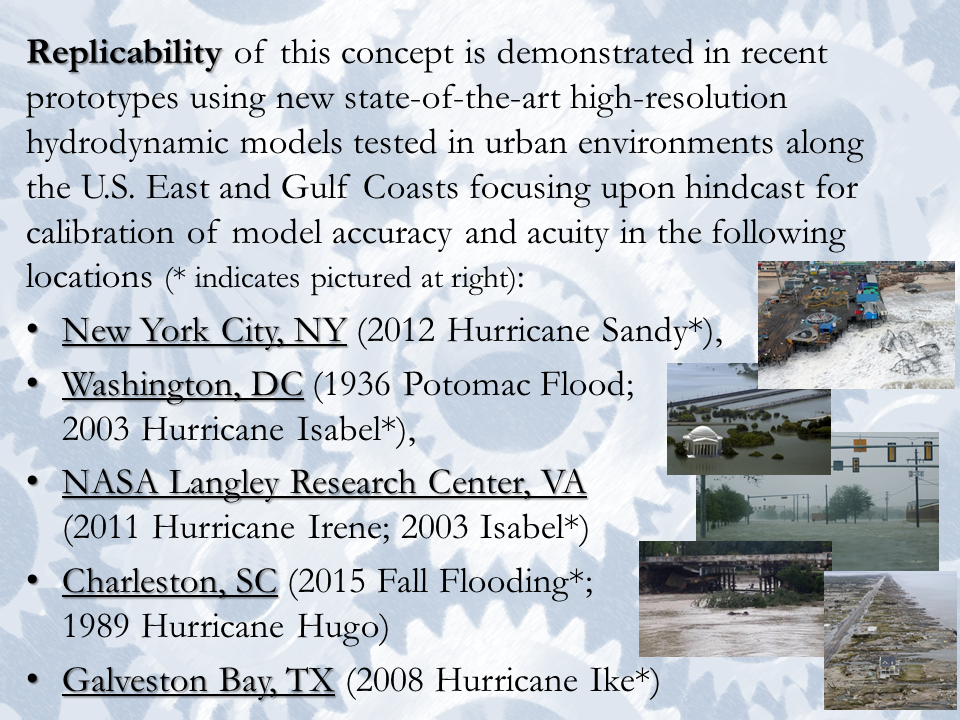
As part of the original grant requirements, StormSense had to be a replicable and scalable program. Loftis has used the computer modeling to “hindcast” other storms on the Gulf Coast, Washington D.C., and New York City. Other project updates include an Alexa voice skill, so residents can query the device to ask about water levels without using the online mapping tools, expanding the sensors and modelling to other neighboring, less dense areas, and integrating the water level information into the Newport News citizen alert system. Between 2016 and 2018 the project has won ten different government innovation and smart cities awards, and has demonstrated cost savings on homeowner flood insurance.

Away from the coasts, the landlocked state of Iowa also deals with severe flooding from rivers like the Mississippi and Missouri. As storms become more frequent and intense, Iowa is dealing with serious impacts; one recent flood resulted in more than one billion dollars in damages, and over the past decade there have been several flood-related deaths. The Iowa Flood Center is a ten year old lab within the University of Iowa that was founded with legislative support in 2009, after devastating floods in eastern Iowa the previous year. The Center uses technology and data to help residents of Iowa better understand flood risks and make better, data-driven decisions about flood prevention and response.
One of their flagship projects is the Iowa Flood Information System (IFIS), a platform that provides “community-based flood conditions, forecasts, visualizations, inundation maps and flood-related information, visualizations and application.” The main mapping application is a trove of information about weather conditions, current water levels, flood alerts, and more. Users can filter the data and zoom into specific addresses or selected rivers, and the visualizations and graphics make the map easy to navigate for the general public. The IFIS streams data from bridge sensors, stream gauges, radars, and forecasts so Iowans can make informed decisions about their homes and safety. Seeing the current flood conditions can help residents decide how to protect their homes, when and where to evacuate, and which areas are most at risk. The picture below shows the current and severe flooding in Davenport with rain conditions, Red Cross shelters, and current flood alerts displayed.

As climate change continues to alter weather, land, and water conditions, residents will need open and clear data to help them decide where to live and how to best protect themselves from issues like sea level rise and flooding. The examples above illustrate how state and local government can work with experts to share data and serve the public during current and predicted climate crises.


