- December 15, 2022
- Data Visualization
From the American Rescue Plan Act (ARPA) to the Infrastructure Investment and Jobs Act (IIJA) to the Inflation Reduction Act (IRA), an unprecedented amount of federal funding is flowing down to municipalities in the US to bolster critical infrastructure. The available money is a dream come true for local leaders with a long wish list of overdue infrastructure projects. However, it is also a challenge for those responsible for planning, prioritizing, executing, and managing a multitude of complex projects simultaneously. In seeking to take advantage of this once-in-a-lifetime influx of federal dollars, local government leaders need data and digital tools to target equitable, place-based infrastructure investments and optimize the use of public resources.
The town of Normal, Illinois has been leveraging Geographic Information Systems (GIS) technology to collaborate on infrastructure projects for several years, even before the current influx of federal dollars. The Town of Normal stands out as a best practice example other local governments in the US should follow as they prepare to make big infrastructure investments for the future.
Planning infrastructure investment on a spreadsheet
Every five years, Normal updates their Community Investment Plan (CIP), a planning tool used to propose major capital investments for the next six years. Historically, the CIP tool looked more like “a glorified Excel spreadsheet”, said Vasudha Gadhiraju, director of innovation and technology (I&T) for the Town of Normal. The spreadsheet offered basic information about a project including the title, location, fiscal year, and proposed dollar amount, among other important details. Viewing this information in a spreadsheet made it challenging for town leaders to coordinate on infrastructure projects, risking waste and inefficient use of town resources.

For example, the Public Works Department may have a road paving project on “A Street” scheduled for summer 2022, but the Water Department may have a water main replacement planned for the same road in Spring 2023. Normal’s department leaders pride themselves on maintaining open lines of communication with one another, but without the ability to visualize where these projects overlap, town leaders could easily miss an opportunity to coordinate and prevent waste (i.e., waiting to pave the road until after the water main has been replaced, rather than having to cut into freshly paved road to replace the water main and repave the road again).
Moving to a GIS-based CIP tool
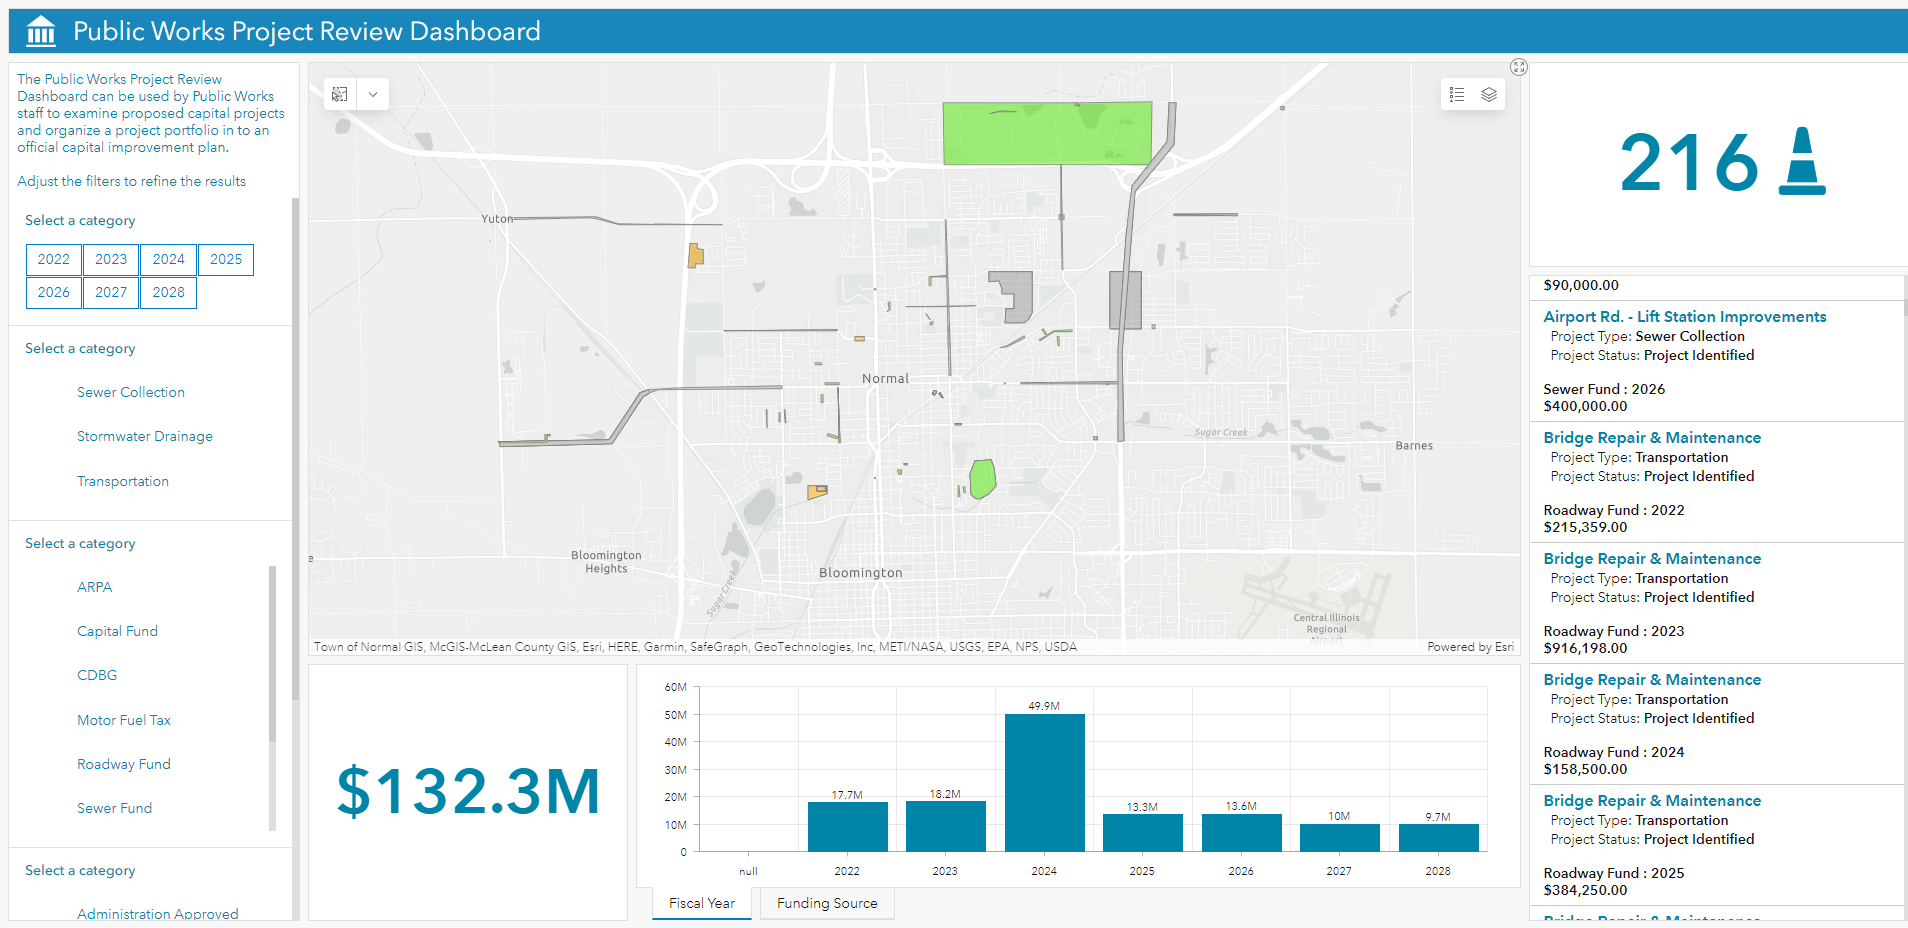
In 2019 when Gadhiraju took on her role, she and her staff conducted an IT needs assessment by interviewing leaders and employees across departments. From this assessment, the I&T department learned the spreadsheet-style CIP was a major source of frustration for leaders seeking to manage public assets more effectively and efficiently. “You're investing tax dollars in improving infrastructure,” said Gadhiraju. “And almost all that investment is location-based. So having to plan your investment without location-based information was very difficult.” After completing the needs assessment, Gadhiraju tasked Normal’s GIS Coordinator Cassidy Killian with building a user-friendly GIS-based CIP tool (see below). The tool was first launched in 2021 and was available for department leaders to use in time for the 2021-2026 CIP update cycle.
In the tool, each department leader is responsible for entering information into the system about planned and ongoing projects. Users must pinpoint the exact location of their projects and each project is color coded by project type (e.g., water, sewer, transportation, etc.), making it easy to see which departments have overlapping projects. Users must also enter in key project details including project category (e.g., water main replacement), status (e.g. Council approved), timing, and the justification for the project. Users can also identify which town plan(s) the project aligns with and what funding sources are tied to it. All department leaders can see what other departments are working on in real-time.

The GIS-based CIP tool was officially launched in early 2022, and town departments have just started to explore the tool to identify collaboration opportunities with other departments and to plan more strategically for infrastructure investments.
In addition to the internal-facing CIP tool featured above, there is also a public-facing CIP tool the community can use to see “council approved” projects in their neighborhoods, increasing transparency on how tax dollars are being put to work and when or where projects will occur.
A major cultural shift
While many department leaders in Normal were asking for a GIS-based CIP tool, making the transition away from the spreadsheet-style tool was a major cultural and operational shift. “When making big technological changes like this, culture change is essential and ongoing,” explained Gadhiraju. She noted it is cultural change, not technological change, that ensures the success of digital transformation in local government. “By focusing on culture change, we’ve been able to break down silos and empower department leaders to work together in ways not possible before,” said Gadhiraju.
The I&T team credited their success to four key factors:
- Executive level support. The I&T team may be well-equipped to build transformational tools on their own, however, Gadhiraju noted it would have been difficult to gain buy-in for the investment in the CIP tool if they did not have executive level support from town leadership. Gadhiraju noted City Manager Pamela Reece has been her team’s biggest cheerleader, advocating fiercely to leverage data and technology to improve government operations and optimize resources.
- Aligning with town strategic priorities. While the I&T team is leading Normal’s innovation projects, these projects align closely with the town's strategic priorities. “Our town Strategic Plan specifically calls out using data and technology to improve efficiency for our Smart City efforts,” explained Gadhiraju, “and that is what we always aim to do.”
- Upfront data gathering to understand departmental needs. Taking the time to meet with each department as part of Gadhiraju’s needs assessment was critical. By discussing in detail what each department needed to do their jobs better, the I&T team identified key pain points and mapped technology solutions to those problems, all while solving a challenge that plagued nearly every town department.
- Building user friendly tools. While technology can really transform how governments operate, the I&T team noted the importance of building user friendly tools to increase adoption. “Do not burden end users with tools that are difficult to use,” explained Spencer Lerch, data specialist for Normal, “Focus on ease of use and minimizing workload if you want people to adopt the tool and ultimately benefit from it.”
When asked to offer advice to other local government leaders, the I&T team emphasized the need to prioritize change management. “With each department responsible for inputting project data into the tool and ensuring information is up to date, you have to make sure that the tool is a part of everyday workflow, which requires change management,” explained Gadhiraju. In Normal, the Communications Department maintains ongoing communications with departmental leaders to ensure project information is up to date. The Finance Department also plays a key role, working directly with department leaders in the CIP tool to ensure funding for projects is accurate and key milestones are being met.
Meanwhile, the I&T team continues to iterate and improve the CIP tool’s capabilities based on continuous feedback they receive from town leaders. “While the CIP is ever-evolving, our hope is department leaders are working in it every day,” said Killian.
Looking ahead
As a next step, Killian and the I&T department are working to embed financial data into the CIP tool to track and report on infrastructure spending as projects move from one stage to the next. The I&T team will soon expand the capabilities of the CIP tool so it can also be used for asset management. The goal is to use data on assets’ conditions to inform and prioritize investments for the foreseeable future. This will also set the town up to both make data-informed infrastructure investments moving forward and to use the tool to advocate for more funding to advance the town’s strategic priorities. “There are a lot of infrastructure dollars out there,” said Killian, “and the more data we can feed into the CIP tool, the better we can plan for and leverage those dollars. In turn, this might put us into a position to receive more funding in the future, so we’re excited for how the CIP tool is going to evolve and grow.”


