
Advanced Digital Tools for Local Climate Action
Many cities and municipalities are utilizing data for mapping and modeling, in particular to address climate change-related issues like extreme heat, increasing rainfall, droughts, or sea level rise. For example, planners on the island of Kaua’i are using GIS to address coastal land loss, and Data-Smart researchers have used data mapping to identify air pollution hotspots in Washington, DC.
Some cities are going even further, leveraging cutting-edge digital tools to address climate change impacts, from extreme heat to flooding. This article explores three innovative examples of municipalities utilizing artificial intelligence and advanced simulation tools to develop more interactive and predictive models that will ultimately result in better policies and safer communities.
Cooling Singapore
Dr. Heiko Aydt, a recent guest on the Data-Smart City Pod, is the head of the Digital Twin Lab and lead investigator of the Digital Urban Climate Twin for Cooling Singapore at the Singapore-ETH Centre. In his podcast episode Dr. Aydt discusses the Digital Urban Climate Twin initiative and navigating cross-sector collaboration. He also provides insights into the academic-government partnership. Below is additional information about the functional development of the climate tools and how the data was utilized to inform modeling and projections.
The development of a digital twin tool for urban climate analysis involves a multi-step approach that integrates advanced data collection, platforms, and technologies. The foundation lies in gathering comprehensive data from diverse sources. Cooling Singapore utilized air temperature and dew point data collected from 22 meteorological observation stations across various land-use types in Singapore. This data was essential for assessing urban heat exposure during critical periods, such as the hottest hours from 2 to 4 pm and the coldest at 7 am. Additionally, satellite imagery played a pivotal role; the Normalized Difference Vegetation Index was derived from high-resolution satellite images like those from the Landsat 8 OLI to measure the cooling impact of green cover and vegetation on urban temperatures.

That data is then integrated with various computational platforms and geospatial software to simulate complex environmental interactions. Key examples include ENVI-met (models microclimates, simulating building and vegetation interactions), OpenFOAM (open-source CFD software for heat distribution and wind flow), and COMSOL Multiphysics (supports multiphysics modeling for urban assessments). Geospatial tools like ArcGIS (integrates environmental, socio-economic, and meteorological data) are also crucial.
The primary goals of the model is informing urban planning and policy-making. Developing these tools allows for the testing of policy scenarios, especially when using high-resolution simulations, which helps urban planners visualize the impacts of proposed interventions. This capability is invaluable for assessing strategies such as adding green spaces or installing cooling infrastructure, facilitating data-driven decision-making processes that can be directly applied by government departments.
City Simulator in Boulder
Just over a decade ago, the Boulder, Colorado region suffered a deadly torrential rainstorm that wreaked havoc on the local infrastructure, destroying thousands of homes and eliminating essential transit routes. While this was considered a 500 year flood, many local officials understood that climate change is upending the traditional occurrences — rather than every few hundred years, floods like this could instead be every few decades.
In order to address future flooding, officials began using the City Simulator tool. City Simulator pulls in GIS data layers, like the natural landscape elevation and built environment, and incorporates weather pattern data with demographic population and policy data; for example, matching information on zoning laws with natural features and socioeconomic data. Much of this simulation, shown in the clip below, runs on Esri mapping technology.
By modeling in a GIS environment, officials aren’t limited by a single discipline and instead can focus holistically on the targeted region. This is especially important for climate change work, as the effects are multifaceted and far reaching. By creating a model that can display different scenarios, officials were able to narrow in on rainfall and test future rainfall predictions. Based on various climate change research models, the team focused on Boulder in 2050 and ran scenarios to see what flooding may look like decades in the future.
This modeling showed that the 2013 flood levels were likely to reoccur, endangering roads and bridges that were built for 100-year water heights. For many people in the community, this was a wake-up call; not because they didn’t believe in the effects previously, but because of the visceral reaction to the City Simulation images. By showing exactly how another flood could destroy the 100-year infrastructure and damage the county, everyone could move forward with resiliency planning from a shared perspective and with increased trust. Currently, local leaders are working with the community on flood projects and priorities, with a focus on equity.
MIT’s Digital Tree Twins
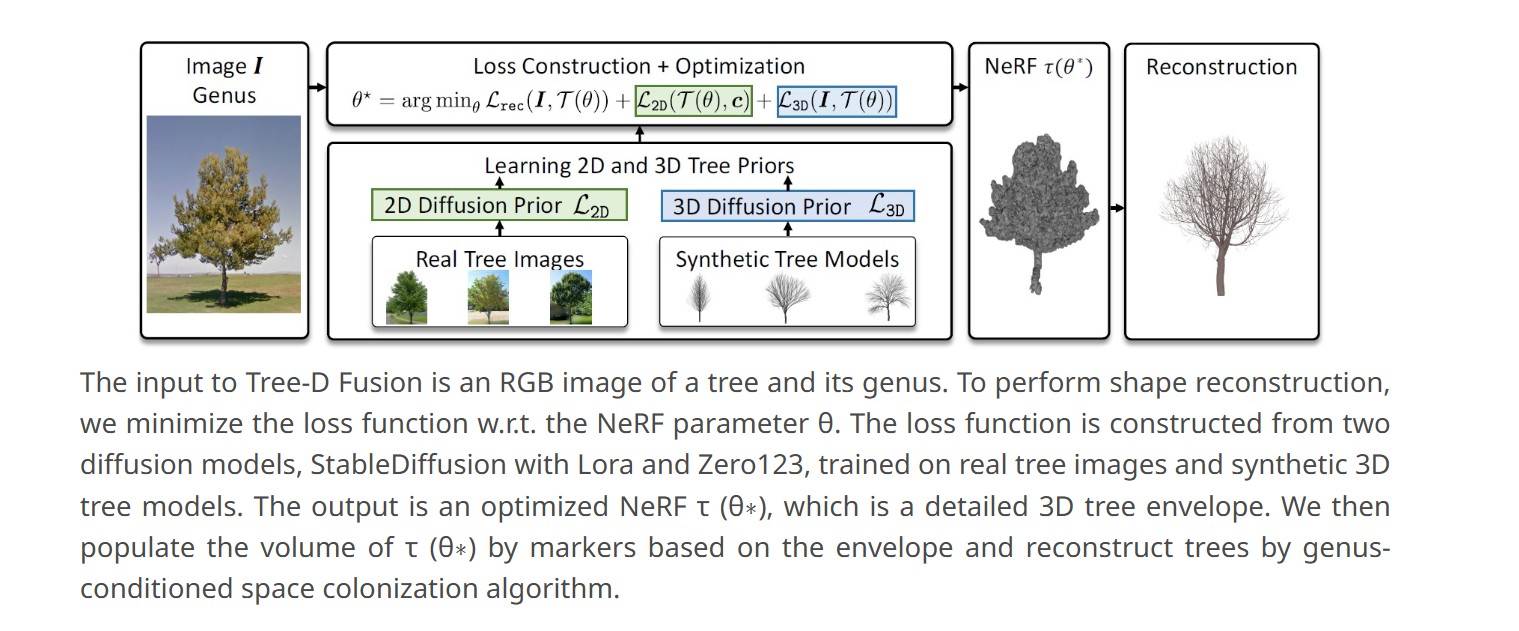
Researchers at the Massachusetts Institute of Technology (MIT) have developed a unique program that creates arboreal-focused digital twins, capable of predicting tree growth under different scenarios. The program, called Tree-D Fusion, uses a combination of single tree images, climate-specific data, and advanced diffusion models to create detailed 3D digital replicas of 600,000 individual trees across North America. Based on genus, the program can model realistic features like occluded branches and species-accurate growth patterns — depending on the environment conditions selected for the simulation. The graphic below outlines the equation that takes a tree image and produces a digital reconstruction.
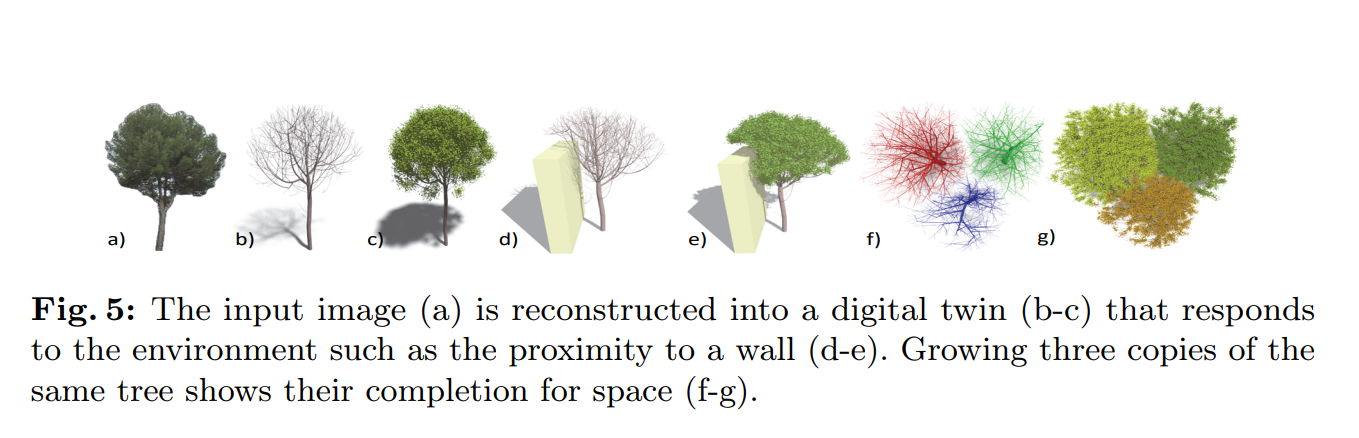
A main motivation behind developing this tool is the knowledge that changing climates will affect urban tree growth, which play a vital role in mitigating heat, improving air quality, and sequestering carbon. Traditional urban forestry isn’t always prepared to preemptively respond to changes in trees from environmental shifts; Tree-D Fusion a significant advancement in this field and will assist municipal tree management. The image below, from the team’s paper Tree-D Fusion: Simulation-Ready Tree Dataset from Single Images with Diffusion Priors, shows how a tree would adapt to changes in the environment, such as a wall, by “building” one next to a tree in the digital twin and observing the growth changes.
There are several benefits for existing and future urban forestry planning. First, it allows urban planners to predict how trees will grow under different conditions, aiding in optimal placement to maximize shade, reduce heat islands, and conserve water. Second, it supports environmental equity by helping cities identify areas that would benefit most from additional or supplemental greenery, depending on the environmental conditions. Lastly, the tool allows researchers to explore how urban trees do, or don’t, adapt to climate stressors like extreme heat and drought to inform future planning.
These examples demonstrate the transformative potential of advanced digital tools in addressing local climate challenges. These models not only provide tailored, data- and place-driven solutions but also foster community engagement by making the impacts of climate change tangible and actionable. By visualizing future scenarios, testing policy interventions, and identifying areas of greatest need, these tools empower policymakers and residents alike to collaborate on meaningful solutions.
For cities looking to adopt similar approaches, leveraging existing technologies and prioritizing data collection can help establish comparable tools within local government. Additionally, cities can partner with universities on development and experimentation. As climate challenges intensify, innovative tools like these will be critical in creating safer, more resilient communities.
About the Author
Betsy Gardner

Betsy Gardner is the editor of Data-Smart City Solutions and the producer of the Data-Smart City Pod. Prior to this, Betsy worked in a variety of roles in higher education, focusing on deconstructing racial and gender inequality through research, writing, and facilitation. She also researched government spending and transparency at the Lincoln Institute of Land Policy. Betsy holds a master’s degree in Urban and Regional Policy from Northeastern University, a bachelor’s degree in Art History from Boston University, and a graduate certificate in Digital Storytelling from the Harvard Extension School.
About the Author
Juncheng "Tony" Yang

Juncheng "Tony" Yang is a doctoral candidate at the Harvard Graduate School of Design and a researcher at Data-Smart City Solutions at Harvard Bloomberg Center for Cities. His research focuses on the intersection of institutional arrangements and emerging technologies in “smart city” governance. Additionally, Yang is a Fellow at the Berkman Klein Center for Internet and Society at Harvard Law School. He received a Master of Science in Urbanism from MIT and a Bachelor of Architecture, with distinction and magna cum laude, from Rice University.