Tracking US Drought Severity

Drought Severity Map

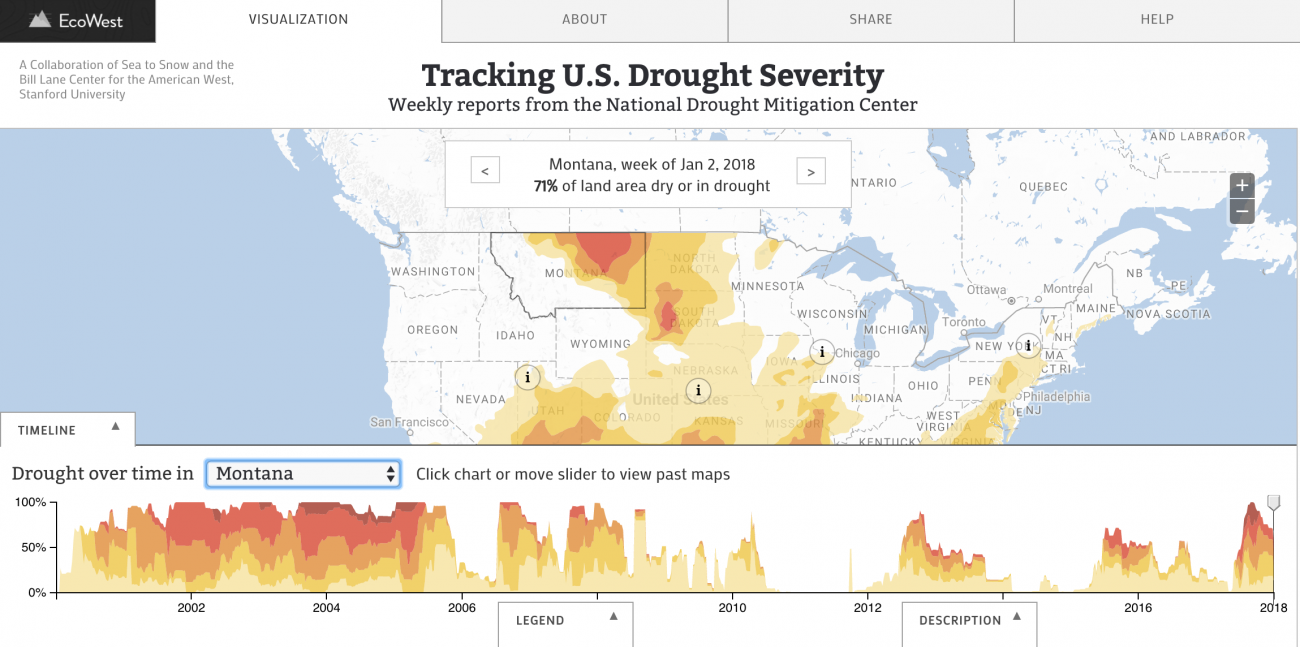
These two interactive graphics track changes in two crucial drought indicators and are intended to better track climatic conditions around the West and the country. The "Tracking U.S. Drought Severity" interactive map presents weekly Drought Monitor analyses for all 50 states, going back to January 2000 and allows users to identify regional and state trends.

Stats

Dataset(s): Drought monitors

Visualization: Map 

Jurisdictions: Regions of the US

Developed by: Stanford University

Get our latest work in your inbox

Sign up for our monthly newsletter

Stay in touch with Data-Smart by signing up for our newsletter below. We share our latest research, podcasts, and articles with our subscribers, so never miss an update by following the link below.

Email icon