Flu Livestory

Flu Livestory Viz-Article

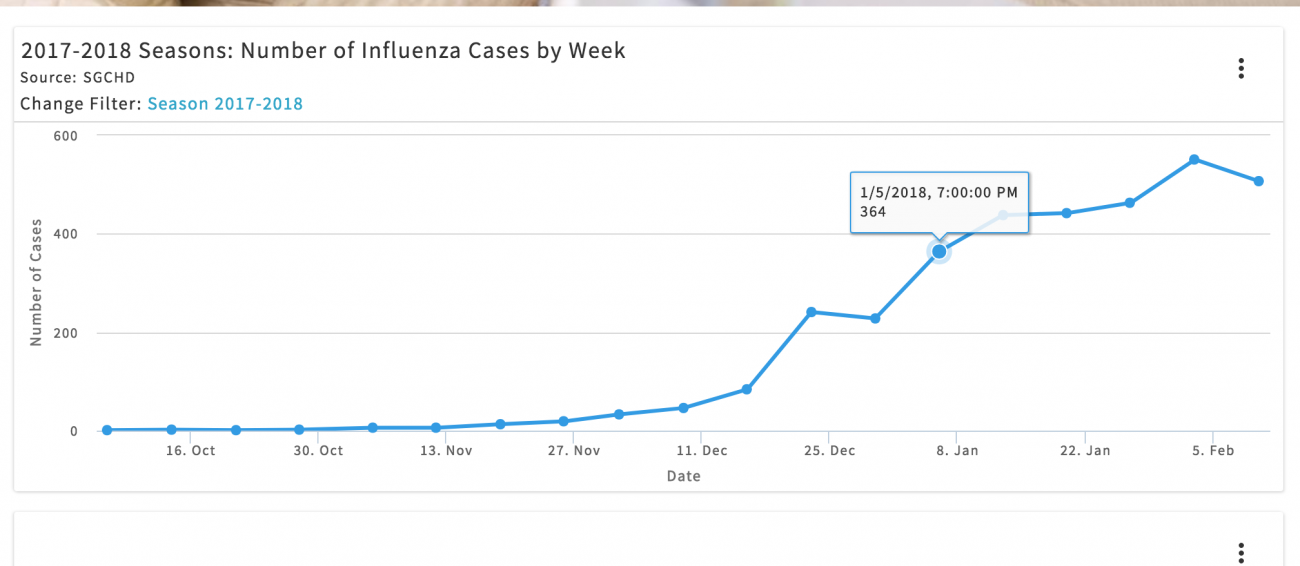
The platform offers a range of interactive data visualizations with information on cases, a guide to symptoms and treatment resources, SGCHD has noticed a decline in calls from media and residents. It’s a trend that’s continuing this year and the agency credits the new data visualization, which tracks cases by week, flu type and age of victim; and offers tips for the ailing, parents and pregnant women.

Stats

Dataset(s): U.S. Census Bureau’s American Community Survey, the Centers for Disease Control and Prevention, the Bureau of Labor Statistics

Visualization: Visualization

Jurisdiction: Springfield-Greene County

Developed by: LiveStory

Get our latest work in your inbox

Sign up for our monthly newsletter

Stay in touch with Data-Smart by signing up for our newsletter below. We share our latest research, podcasts, and articles with our subscribers, so never miss an update by following the link below.

Email icon