Economic Complexity in Metropolitan Areas of the United States
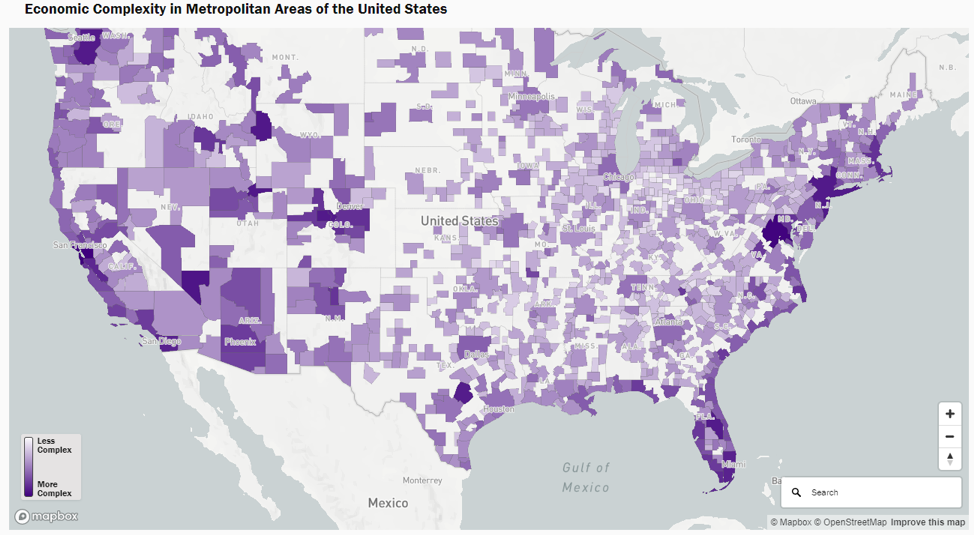
This map uses economic complexity indices to demonstrate and compare the potential that US metro areas have to grow, and sustain good jobs, as labor markets change. These changes are a result of the "technological revolution" that is changing up where workers live and which industries are growing. The map allows users to zoom in on cities and regions, showing each area's Economic Complexity Index (ECI), a measure that “describes cities and their implicit capabilities by the complexity of the industries they host.” The higher a city’s ECI, the better it can diversify its products and services, therefore increasing its ability to create new and better paying jobs in several different industries.
Stats
Dataset(s): Workforce of the Future Initiative analysis of Emsi estimates
Visualization: Dashboard, Map
Jurisdiction: United States
Developed by: The Brookings Institute
Map Monday: Leveraging Maps and Data to Drive Inclusive Growth in Cities

