

On and Off the Street Grid: Relative Distributions of Road Orientations
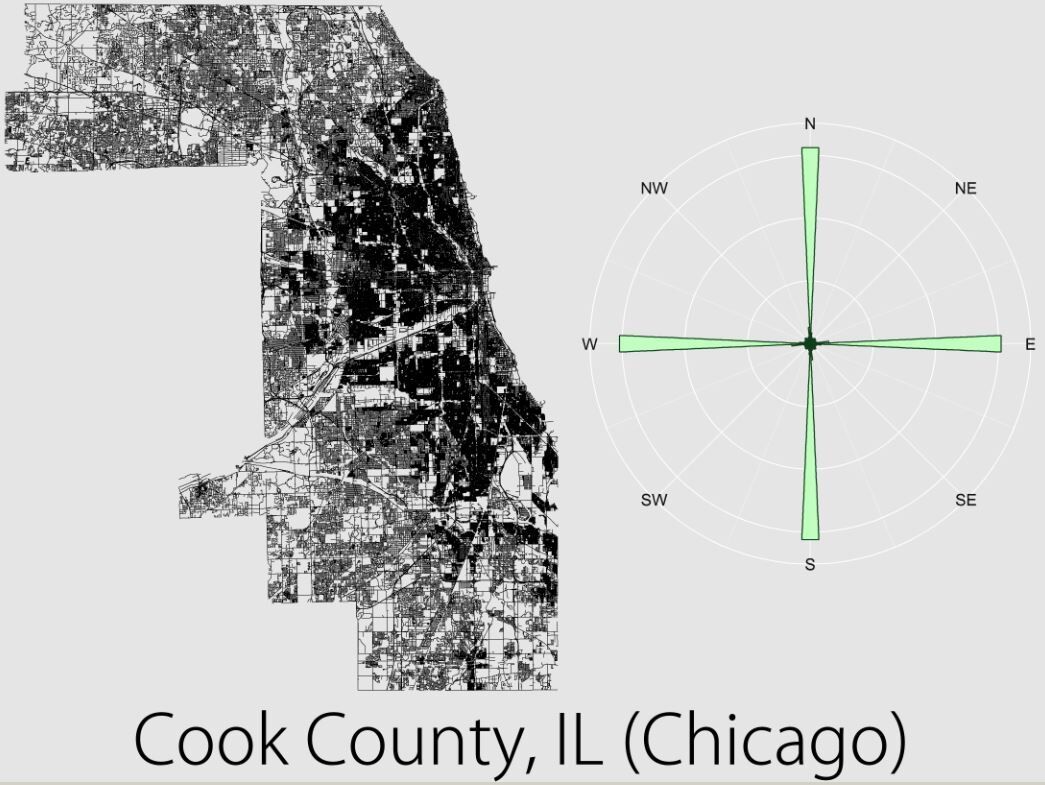
In a new set of data visualizations, users can compare the street grids of two dozen urban centers across the U.S. and Europe. The graphs, which plot the orientations of every road in a county or city, reveal just how much that region conforms to a street grid. In each graph, the tallest bar indicates the direction that more roads point to than any other direction. To ensure rotational symmetry in the graphs, each road is plotted to run in both directions, regardless of whether they're actually one-way or two-way.
