- April 30, 2019
- Civic Analytics Network
Rebecca Hefner speaks in superpowers. Over the course of our conversation, she reveals her own personal data superpower: getting others excited about analytics and collaborating with them on data projects. And she reiterates her team’s motto, scrawled above the door jamb of their two-person office: Making Heroes Out of Others.
This is not a duty that Rebecca takes lightly. As the Data & Analytics Director at the Charlotte Office of Data & Analytics, she constantly engages in cross-departmental projects. Since the office is an initiative of the City Manager’s Office, it addresses data needs across a broad spectrum of city services and departments. And as one member of a two-person team, Hefner is on the front line, helping departments see what they can do differently with data. Her passion for the work permeates across boundaries; to her, anyone who can collaboratively problem solve can do analytics. And of course, ‘non-data people’ love her holiday celebrations like Pi Day, too. This communal spirit is all part of Rebecca’s mission to elevate the environment, a goal that extends past local government and into the city.
In 1993 the City of Charlotte launched an annual Quality of Life study, which measured social, physical, economic, criminal, and environmental conditions within neighborhoods. This study continued yearly in partnership with the University of North Carolina Charlotte, with results published in large, printed reports (PDFs of the early reports are now available online). In this original iteration, the Explorer reported only a handful of indices like Percent of Births to Adolescents, Juvenile Arrest Rate, and Pedestrian Friendliness Index. The Explorer also assigned ranking labels to neighborhoods: Stable, Threatened, and Fragile.
By 2012 a city team, spearheaded by Tom Warshauer and John Howard in the Community Engagement Division of Housing & Neighborhood Services (HNS), decided to increase the accessibility of this wealth of information. Warshauer created a partnership with the Mecklenburg County government, and a county developer built a digital tool dubbed the Quality of Life Explorer. Collaborating with the county meant there wasn’t a huge funding burden on the city. When the information was digitized, the neighborhood labels were also removed; the stark categorizations hadn’t sat well with city residents.
Hefner joined the HNS team in October 2013, shortly after the digitization and the removal of the labels. As she explained, those labels weren’t fair representations of the diversity and vibrancy of each neighborhood. As someone who aims to elevate others through her data work, she worried that if the labels had continued certain communities could be stunted by a negative designation. Within the next two years Hefner and the team worked to make other inclusive changes; they increased the number of indicators reported and built neighborhood engagement processes around the tool. Users can now visualize one of 80 metrics on a map of 464 neighborhoods in the entire Charlotte-Mecklenburg County.
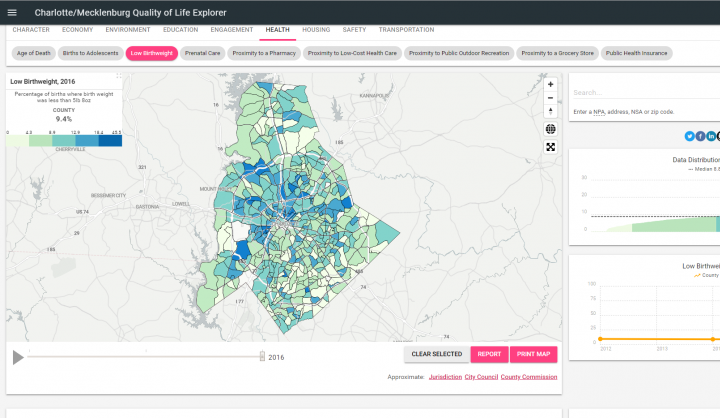
The map is the focal point of the Explorer page, with the indicators grouped at the top into categories like Economy, Health, and Transportation. Selecting one of those shows the specific indicators for each topic, and once an indicator is selected the map transforms to visualize the data. Users can zoom in to see specific streets, click to highlight a neighborhood, and even run a timeline slider to see changes over the past few years.
Sidebar graphs show the data distribution, county to neighborhood variance, and a map key, with easy-to-understand explanations. And every Explorer iteration has a section that details why that indicator is important, how Charlotte-Mecklenburg is doing, and related variables to explore. This emphasis on visualizing and translating the data really centers the user experience. Mapping increases accessibility, and doesn’t require any special data knowledge or tools. By visualizing the data, Hefner’s office is adding value for the community.
Now the Explorer plays a key role in helping neighborhood groups build their own local strategies. The Charlotte’s Housing and Neighborhood Services Community Engagement division hosts community board retreats every year to guide neighborhoods through a data-informed strategic planning process. Using the Explorer tool, groups are able to chart improvements, identify what data stories they don’t like, and discuss what they can do about that. Data-driven decisions can be made about greatest needs and program investments. City libraries train local nonprofits on the tool so all groups can use data in their grant proposals, not just the ones that can budget for a study on their key indicators.
These are the victories that drive Hefner’s data work. Her office is already creating future functionalities that will show more specific data with an equity lens, and allow users to build their own maps from the city’s open data. Rebecca’s goal is to have residents seamlessly move from data to problem solving by asking “What is the problem? Which is the right tool? And whom do I ask in city government?” This vision turns everyone into their own advocate, or as Rebecca prefers, their own hero.
Interested in helping data heroes in your city? The Quality of Life Explorer is open source and the code is available on GitHub.


