- April 19, 2021
- COVID-19
Prior to taking office, President Biden promised to have 100 million COVID-19 vaccines administered by his 100th day in office. But after meeting that goal on day 58, he updated it to twice the original target—200 million vaccines in 100 days. As we approach the self-imposed deadline of April 30th, is the US equipped to meet this new and ambitious goal?
Beyond simply tracking the rollout of COVID-19 vaccines, newspapers like the New York Times and Wall Street Journal have used data from the Centers for Disease Control and Prevention (CDC) to forecast distribution rates, segment information by counties’ social vulnerability, and map eligibility requirements. The plethora of synergies which have flourished from centralizing reliable CDC information and making it available for public re-use has set a new precedent in data’s potential to shape the public discourse. At a time when eligibility guidelines continue to change and a significant portion of the US remains hesitant to receive the vaccine, reliable information is an important antidote to panic and misinformation. This post highlights what is working, what needs to be improved, and what is concerning regarding COVID-19 vaccination efforts.
What’s working?— Transparent dashboards reflect significant progress in vaccine distribution
The CDC’s COVID-19 data tracker provides daily updates on vaccination information at the county level by integrating records from all providers and cross-referencing this database with information from the 2019 Vintage Census Population Estimates and the 2018 CIA World Factbook. This allows the public to examine important public health variables beyond simply number of doses administered, such as county-level population density, household size, insurance status, and poverty level.
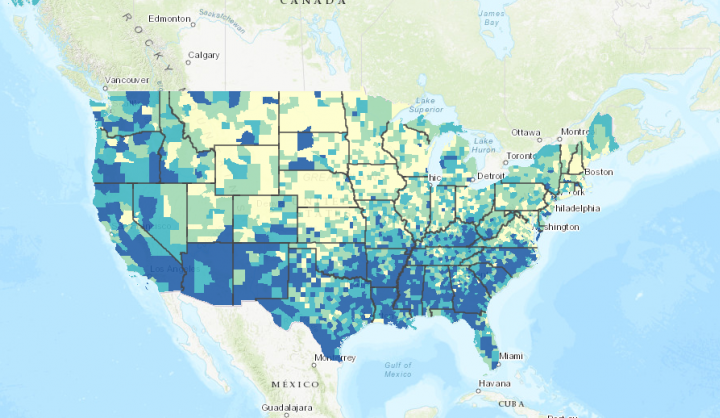
As evidence shows that COVID-19 has disproportionately affected racial/ethnic minority groups and individuals who are economically and/or socially disadvantaged, the CDC has been publishing other indicators to understand how vaccination is evolving in vulnerable communities. Using census data, the CDC computes Social Vulnerability Index (SVI) scores, which complement the COVID-19 Community Vulnerability Index (CCVI) scores designed by Surgo Ventures – an organization that combines “behavioral science, data science, and artificial intelligence to unlock solutions that will save and improve people’s lives.” Both scores range from 0 (least vulnerable) to 1 (most vulnerable) and aim to explain how and why communities are vulnerable so that vaccination efforts can be better targeted. The integration of these various data sources allows the CDC to not only track doses administered and doses still needed, but also informs local authorities on how to structure eligibility guidelines. For example, California initially restricted vaccination to high-risk and 65+ citizens, and only after being guaranteed that supply of vaccines would significantly increase, decided to extend first to 50+ and later to 16+ individuals. Updating their vaccine allocation methodology in conjunction with non-traditional outreach, such as partnering with agricultural and community-based organizations to vaccinate agriculture workers, allowed those counties’ authorities to access typically hard-to-reach communities.
The live dashboards below, both of which are based on CDC data, evidence the tremendous progress made with vaccinations in recent weeks. As of Sunday, April 11th, approximately 119.2 million people had received at least one dose of a vaccine, including over 72.6 million people who were fully vaccinated either by Johnson & Johnson’s single-dose vaccine or the two-dose series made by Pfizer-BioNTech and Moderna. Additionally, the rate at which vaccines are made available continues to increase, with providers currently administering on average about 3.11 million doses per day: at the current pace, the New York Times estimates that 90 percent of the eligible US population will be vaccinated by mid-July.
WALL STREET JOURNAL- TRACKING COVID-19 VACCINE DISTRIBUTION DASHBOARD

NEW YORK TIMES VACCINATION FORECASTS BASED ON CDC DATA

What can be improved?- Significant geographic disparities in vaccination rates remain.
The CDC data reveals concerning heterogeneities in vaccination rates among different states and even counties. For example, as of April 12th, 22 percent of the total US population had been fully vaccinated. However, in New Mexico this rate climbs to 29 percent, whereas in Georgia it drops to 15 percent. It is important to remember that these differences do not necessarily reflect inefficiencies in administering vaccines, but may have many other underlying explanations, ranging from different eligibility restrictions stemming from a concern for demand outstripping supply, to demographic differences among states, to different levels of interest in getting shots among residents.
Here as well, government and non-government organizations have taken it upon themselves to consolidate varying and volatile vaccination policies into easy-to-use and easy-to-understand primers that reflect when and where specific groups will be eligible to receive the vaccine. For example, the New York Times has comprised a list of eligible occupations which reflect the most up-to-date restrictions in each state.

As evidenced in all maps constructed using CDC data, some states are exceptions due to the way they track vaccinations at the county level, further contributing to the information disparities that might hinder an optimal rollout strategy. For example, Hawaii does not provide the CDC with county-of-residence information, while Texas provides data that is aggregated at the state level and cannot be stratified by county. Additionally, some cities like Chicago track and publish their own data on vaccinations, but this is not standard across all cities and surrounding counties.
What is concerning?— Vaccine hesitancy might be a real threat to public health efforts
While it may seem that the end of the pandemic is in sight, success in beating COVID-19 will also depend on the US achieving “herd immunity”— the point when enough people are immune to the virus that it can no longer spread through the population. Reaching that point, however, depends not just on how quickly people can be vaccinated, but also on several other factors including how many people want to be vaccinated.
“Vaccine hesitancy” — skepticism or cynicism about taking vaccines — is beginning to show up in the data as availability increases. For example, in Mississippi, the pileup of unclaimed appointments recently exposed the added challenge of getting people to take the shot. Similarly, only 68 percent of North Dakota residents are willing to receive the vaccine with reasons spanning the spectrum of politics, religion, science, and individual freedoms. This means that the different paces at which people get vaccinated might be unrelated to operational capacities or vaccine supply, and instead be explained by heterogeneous vaccine hesitancy rates.
Addressing vaccine hesitancy will be especially important given CDC’s recent decision to pause the use of the Johnson & Johnson vaccine “out of an abundance of caution” and convening an emergency meeting of experts to further investigate the impact of potential side effects. Although the CDC director indicated that “We believe these events to be extremely rare,” early data from an Economist/YouGov poll suggests that the CDC’s decision to pause the vaccine may have dented public perception—the announcement resulted in a decrease in the proportion of people who considered the shot “very safe” or “somewhat safe” from 52 percent before the announcement to 37 percent right after.
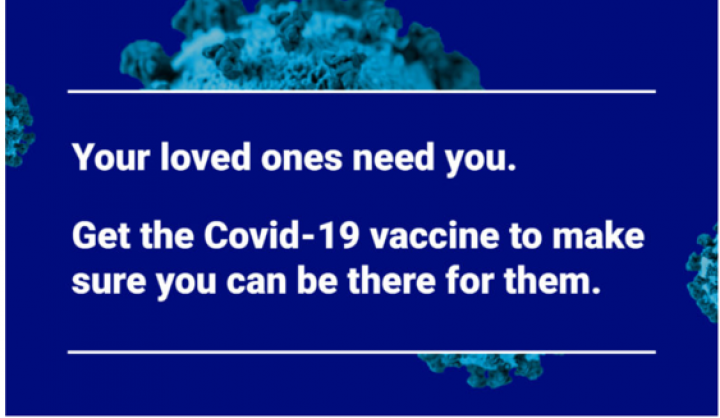
In this sense, public efforts emphasizing the safety of the vaccine and the importance of strong turnout will be vital in thwarting the virus as more doses become available and more people become eligible for shots. Public information and news sources will play a pivotal role in keeping the population informed and healthy. For example, a recent study by the Behavioral Insights Team, a company which “applies behavioral insights to inform policy, improve public services and deliver results for citizens and society,” may provide some guidance on which kinds of messages are most effective at targeting vaccine hesitancy. As part of a group of randomized control trials examining different approaches to encourage people to get the shot, they concluded that messages that refer to “helping loved ones” increased willingness to vaccinate across all hesitant groups. This message resonated with people’s desire to protect their friends and family and “It made clear that vaccinating yourself can help your loved ones while being careful not to overstate the vaccine’s power to reduce or eliminate transmission.”

The complexity in addressing hesitancy is that it requires healthcare providers to be able to recognize barriers to vaccination acceptance while at the same time maintaining respect for differences. This will require creative and innovative approaches by state and local authorities such as providing community education, increasing access to shots to the vulnerable and underserved, and enlisting champions of faith and community influencers to enhance vaccine confidence and trust. California has recently taken steps in this direction by spending $40 million on the “Let’s Get to ImmUnity” campaign, which seeks to reach all age groups and communities with paid digital advertisements, social media outreach, and an "influencer" campaign on TikTok, Instagram and YouTube. Additionally, English and Spanish language television and radio ads will begin airing, along with additional outreach measures in Mandarin, Cantonese, Vietnamese, Korean, Arabic, Russian and Japanese. Efforts such as these that refine and adapt strategies to increase uptake of the COVID-19 vaccine will be vital in fighting disinformation and misinformation around vaccination.


