On January 22nd, the US reported its first case of COVID-19. Now, just 3 months later, cases have exploded and are now approaching 800,000 as I write this article. One month ago, I wrote a piece highlighting mapping best practices in local government in response to this outbreak, at a time where the US only had about 33,000 confirmed cases and very few governments had built publicly available maps. Since then, I have been keeping track of new maps that are guiding local and state decisionmakers as the virus spreads in their cities. The following are some new, innovative maps that leaders can replicate to help their cities during the pandemic.
HIGHLIGHTING RACIAL DISPARITIES IN MILWAUKEE
Public health professionals have long understood that the health of ethnic minority groups is disproportionately impacted by natural and man-made disasters in the US. Prior to COVID-19, the CDC created the Social Vulnerability Index (SVI) to help emergency and public health professionals better anticipate which communities will be adversely impacted by disasters; one of the four key criteria being race/ethnicity/language. As the outbreak has worsened across the US, states are beginning to track and release data on race to highlight disparities -- unsurprisingly, black and Latinx communities are taking a disproportionate hit in nearly every place where this data is being reported.
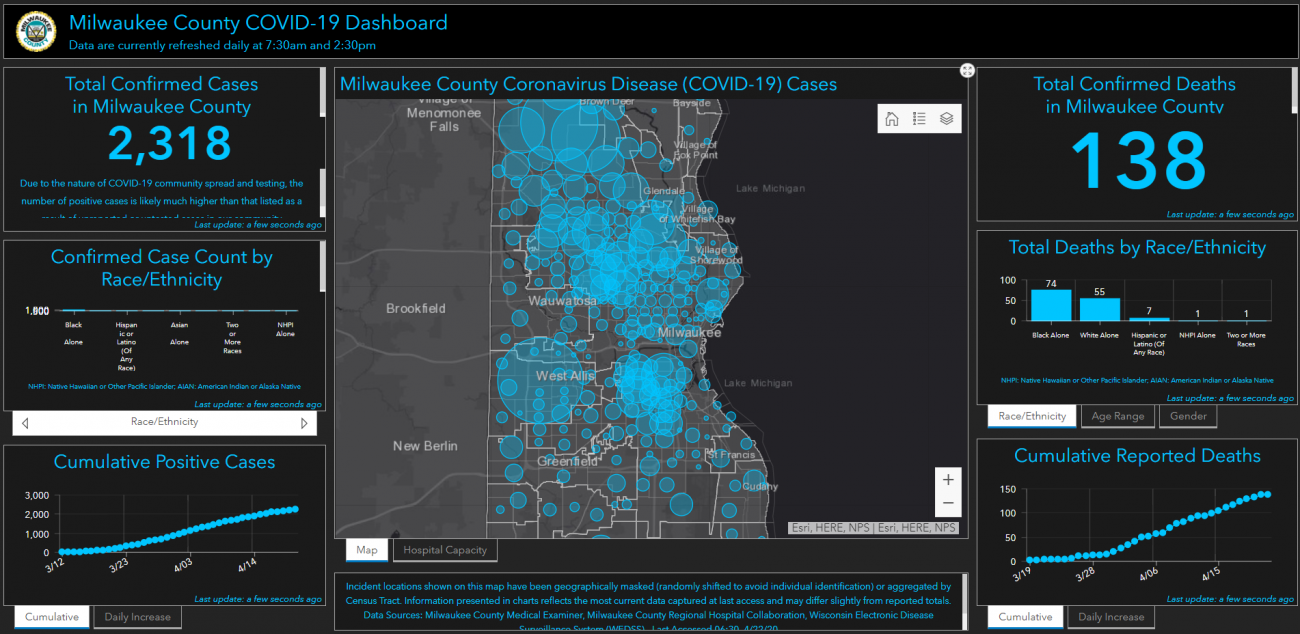
Milwaukee County was one of the first local governments in the US to release this information publicly in a dashboard. The map below, from the County’s COVID-19 website, is updated twice per day and allows users to add data layers including the CDC’s SVI, as well as demographic data such as age, gender, and race. As I write this article, 44% of confirmed cases and 54% of those who have died in Milwaukee County were black residents despite accounting for just 26% of the city’s population. Compare that to white residents who account for 23% of confirmed cases and 40% of deaths despite being 51% of the population. You can explore the map here.
Milwaukee County COVID-19 Dashboard
IMPROVING FOOD AND INTERNET ACCESS IN SYRACUSE
Even before COVID-19, millions across the globe were considered “food insecure.” Many children in the US were reliant on meals they got at school, but school closures across the country have put many of those students at risk of losing out on critical meals. To combat that, the City of Syracuse mapped out the distances every student living in poverty in the city would have to walk to get food at their initial food distribution sites (see below). Officials then partnered with the school district to find new locations so every student who needs food can get it more easily.
Meal distribution sites in the City of Syracuse
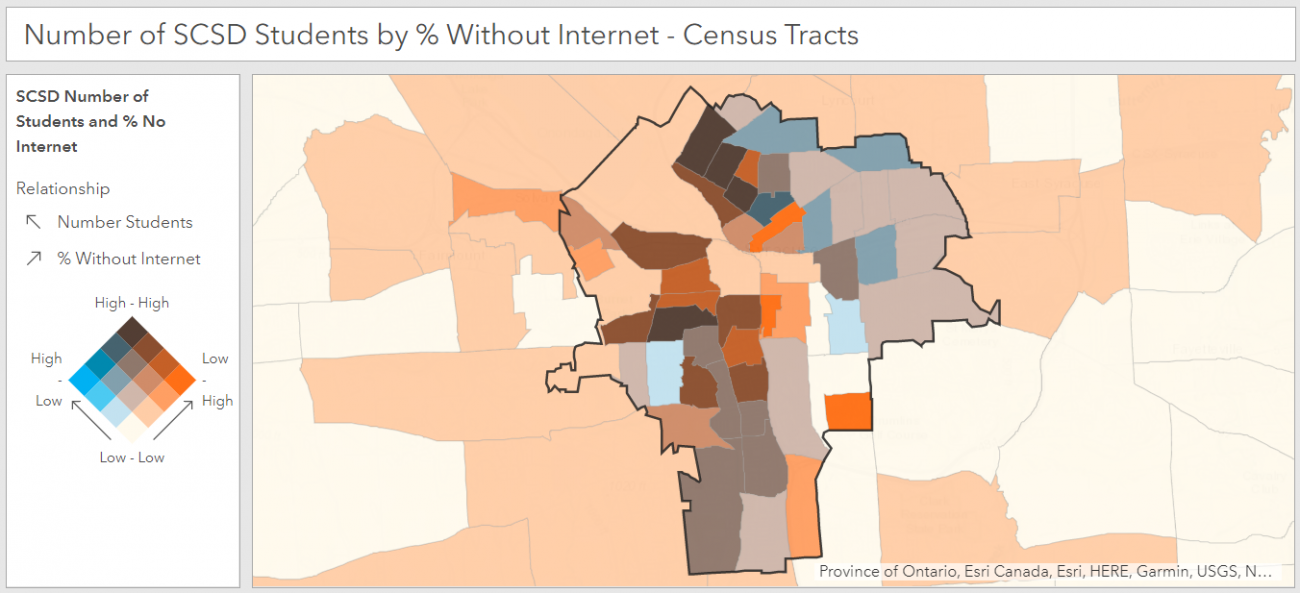
In addition to food insecurity, this outbreak has also brought to our attention the massive gaps in broadband access for students. As schools close their doors and attempt to move classes online, we are discovering just how many students are unable to do work remotely or even dial in to virtual lectures. Recognizing this, Syracuse is also using maps to help the school district identify where students do not have access to the internet or computer devices at home. The school districts hopes to use these maps to understand where access is lacking and how they can help students get the access they need to continue to learn. See the map they have built below.
MONITORING HOSPITAL CAPACITY AND PREPAREDNESS IN PENNSYLVANIA
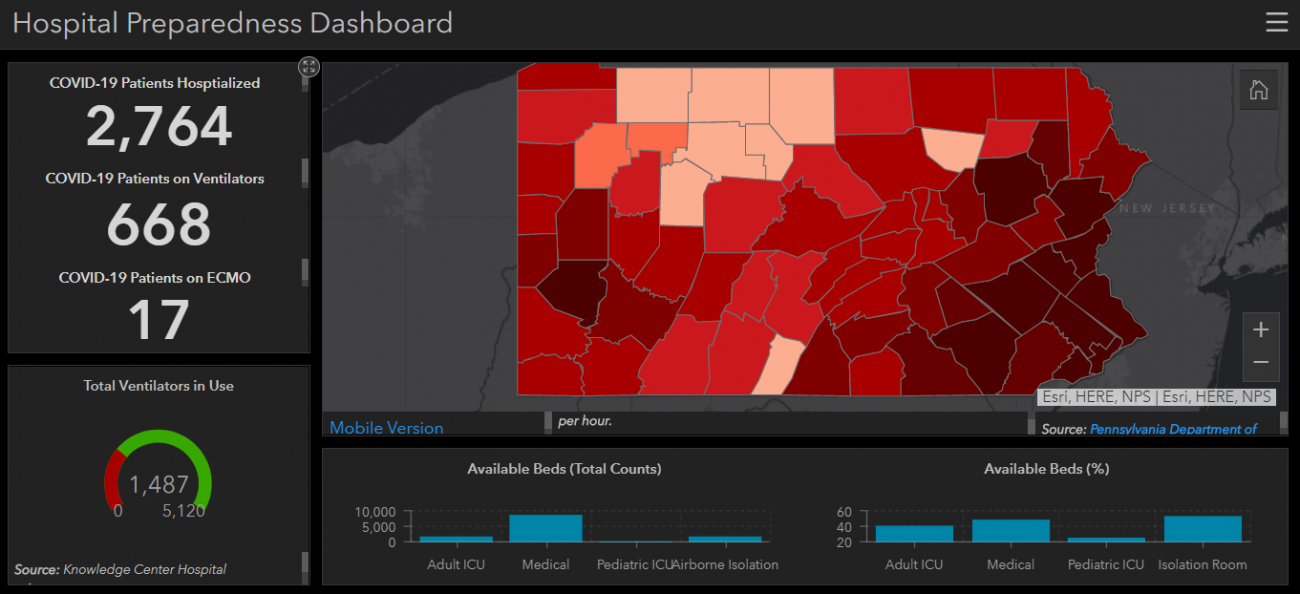
From Spain to New York City, we continue to hear stories about the very difficult choices doctors and nurses are being forced to make about who receives lifesaving care as hospitals reach max capacity. In preparation for this type of crisis scenario, the Pennsylvania Department of Health has built the Hospital Preparedness Dashboard. The map highlights counties across the state with the highest number of cases and includes information from the Knowledge Center Hospital Information Management System about hospital bed capacity and ventilator availability. This dashboard will help inform resource allocation and monitor healthcare capabilities as the virus continues to spread.
CONNECTING WITH AND HELPING LOCAL LEADERS IN RIO DE JANIERO
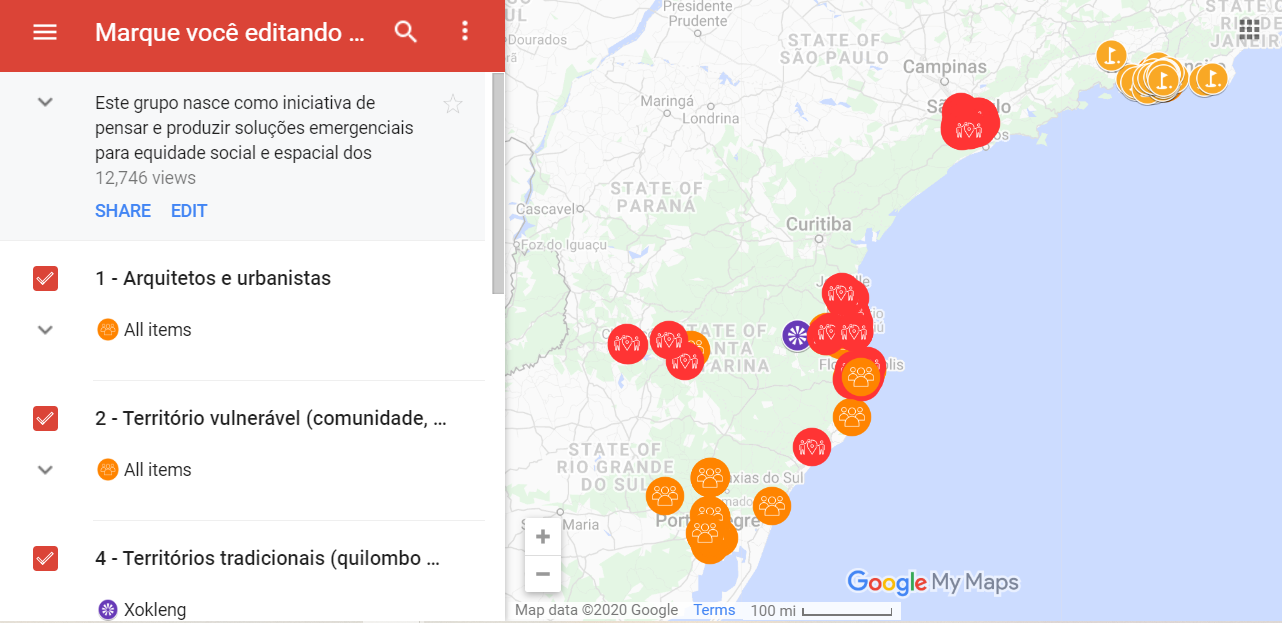
As with any virus or pandemic, cities with higher population densities have a correspondingly higher risk of high case numbers. This is true in the US (although density isn’t the only key factor), but it is especially true of high population density cities in developing countries. That is why a volunteer group of urbanists, planners, philanthropists and others came together in the city of Rio de Janiero to support residents living in favelas (or slums) during the COVID-19 crisis. The “Urbanists Against Coronavirus” website says that the group “was born as an initiative to think and produce emergency solutions for social and spatial equity in peripheral spaces in the face of the COVID-19 pandemic.” Together the group has collaborated on a map (see below) so individuals can reach out to local leaders in the favelas, and to provide help or resources to those who live there. This network has since expanded to other states throughout Brazil.
Additionally, this article from the Carnegie Endowment for International Peace gives more information about other innovative and creative ways locals leaders in Brazil are supporting vulnerable residents.
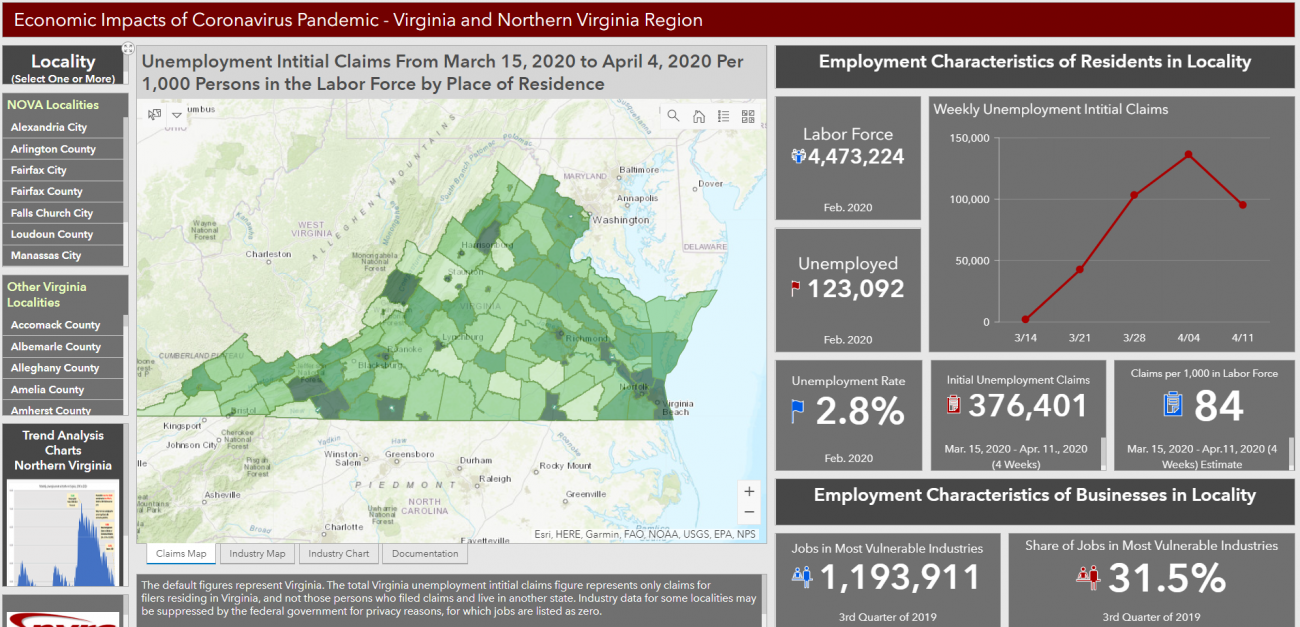
TRACKING UNEMPLOYMENT CLAIMS IN VIRGINIA
Unemployment claims across the US are rising weekly, dwarfing the numbers seen during the Great Recession a decade ago. To monitor unemployment trends in the state, the Northern Virginia Regional Commission built a dashboard showing the economic impacts and risks posed by the pandemic. The dashboard breaks down counties with the highest number of claims and share of jobs in the industries most vulnerable to the outbreak. Other data included in the dashboard are the number of unemployed individuals, the rate of claims per 1,000 in the labor force, and the number and percent of jobs overall that are in vulnerable industries.
As the virus continues to spread throughout the US and other parts of the world, new and innovative mapping solutions continue to emerge. If you are involved in any mapping projects related to COVID-19 response in state or local government, or if you know of other projects or solutions that deserve a shout out from anywhere in the world, please email them to me at matthew_leger@hks.harvard.edu
About the Author
Matthew Leger
Matt Leger is a Research Assistant for the Innovations in Government Program at the Ash Center. He has a diversity of experiences in research across the public and private sectors, as well as in academia with a primary focus on understanding how technology can be used to help address some of society’s greatest challenges. Matt has worked with the Smart Cities Strategies team at the International Data Corporation (IDC); the NYCx team in the NYC Mayor’s Office of the Chief Technology Officer; and at the research institute CTG-UAlbany. He holds a Bachelor of Arts in Public Policy and a Master’s Degree in Public Administration both from the Nelson A. Rockefeller College of Public Affairs and Policy at the University at Albany in Albany, NY.