


New Tool Maps Deadly Heat Risks in California
A new data map ranks California communities’ heat risk to warn residents and prevent deadly illnesses as temperatures keep rising.
If it seems like more and more news headlines are revolving around higher temperatures and heat waves across the United States this summer, you’re not imagining it.
2024 was the hottest year on record, surpassing the last previous hottest year: 2023. A new report published in June shows that the world is becoming warmer, faster. And so far in 2025, heat-related illnesses have reportedly killed 11 people in Maryland, and 29 people in Nevada.
California, with its increasingly-long wildfire seasons and rising temperatures, is no stranger to the effects of extreme heat. In January of this year, Southern California experienced a series of devastating wildfires that killed at least 30 people, forced over 200,000 residents to evacuate, and razed over 57,000 acres of land – resulting in some of the most destructive fires in California’s history.
While there is a direct connection between wildfires and hotter temperatures, the consequences of extreme heat are wide-ranging and can even be more lethal than wildfires. “Extreme heat is oftentimes referred to as a silent killer,” said Walker Wieland, the Environmental Program Manager at the Office of Environmental Health Hazard Assessment (OEHHA) in California, “and it doesn't really have these scenes of catastrophe like you might see with other climate related hazards, but it does actually make more people sick and take more lives than any other climate related hazard.”
Creating awareness of extreme heat’s potentially deadly ramifications and mitigating those is the sole aim of OEHHA’s latest public health effort that debuted at the beginning of this year – the California Communities Extreme Heat Scoring System, or CalHeatScore.
CalHeatScore is a web mapping tool that uses a heat-health ranking system that aims to keep California’s residents informed of both local and regional extreme heat events in the state. To do this, the tool translates weather information into easy-to-understand heat scores that indicate increasing levels of health risk from extreme heat in addition to local resources, such as cooling centers, to help alleviate those risks.
“There's low awareness throughout the state and throughout parts of the world on the dangers of extreme heat and also what preparation people can take to mitigate the impacts,” said Wieland. “Our mission with this extreme heat ranking system in California is to protect the health and well being of all Californians from extreme heat, with a lens on those who are most vulnerable.”
Using Data to Create a Literal ‘Heat Map’
After a record-breaking and devastating heat wave in September 2022 that killed 395 people in California, the state’s governor Gavin Newsom signed Assembly Bill No. 2238 into law. This bill required the California Environmental Protection Agency (CalEPA) to create a statewide extreme heat ranking system. In partnership with UCLA’s Center for Healthy Climate Solutions, OEHHA developed the model for CalHeatScore, incorporating recommendations from the California Department of Insurance, Department of Public Health, the Governor’s Office of Land Use and Climate Management, and the Governor’s Office of Emergency Services.
Everyday, CalHeatScore ranks each zip code throughout the state – approximately 1,800 – from a range of zero to four. The zero ranking (low) means there are no elevated community risks of heat-related illness with a level 4 ranking (severe) meaning community risk of heat-related illnesses may be more than double the calculated baseline.
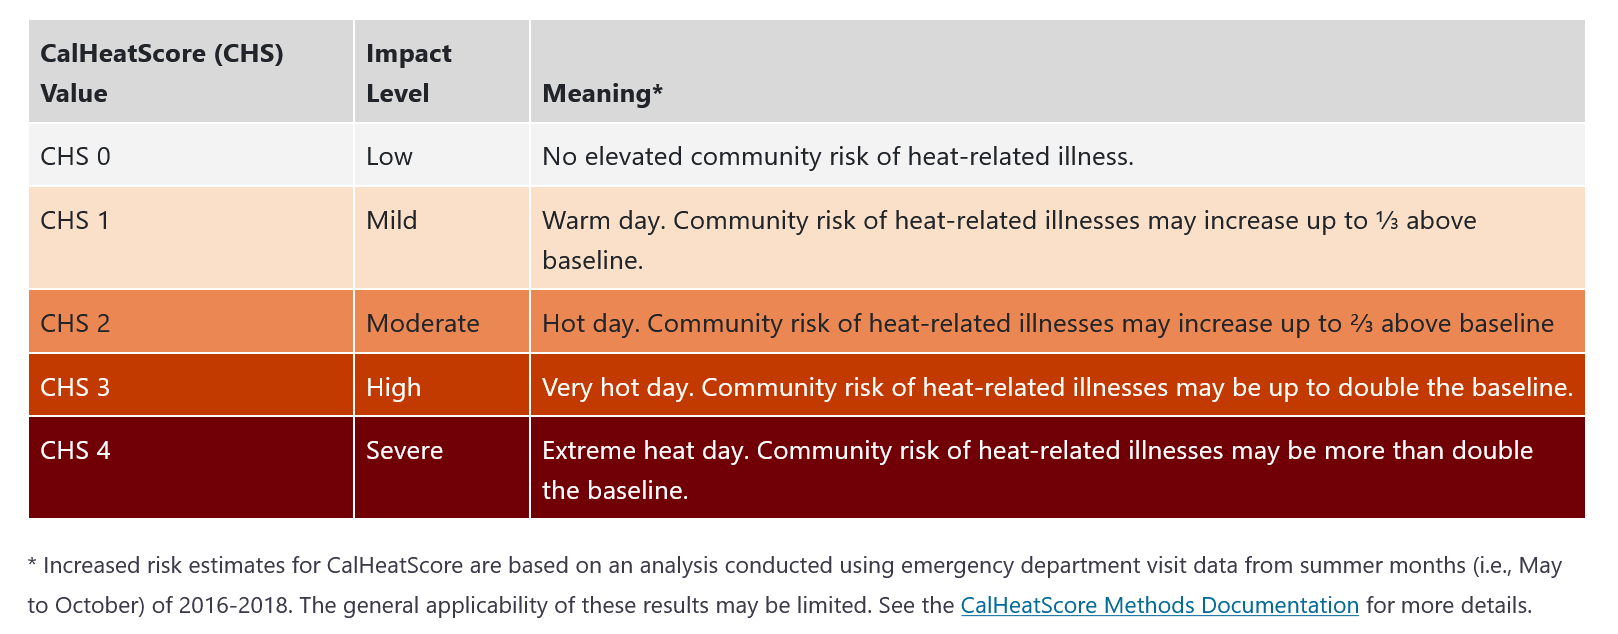
In order to determine the hyperlocal rankings, CalHeatScore incorporates localized weather data from the National Oceanic and Atmospheric Administration (NOAA) and localized emergency department data to ascertain a tailored view of what extreme heat conditions are in relation to the average conditions in each community and how people in those communities respond to it.
“California is extremely diverse, and so a hot day in Oakland might be very different from a hot day in Fresno or Redding,” said Wieland.

For its data assembly, CalHeatScore’s analysts calculate the average heat conditions from a 30-year period in all zip codes throughout California for the heat season to determine a baseline level of heat in each area. Then, the CalHeatScore team analyzes emergency department data from California’s 300+ emergency departments to match spikes in emergency department visits for heat-related illnesses to spikes in temperature. This allows CalHeatScore to form regression relationships between every community, explained Wieland. Currently, this is done with data from 2016 to 2018 with plans to expand to a longer time frame.
“It's space bound, but also time bound – we're looking at where you are in the summer and how sick people are getting in your community based on that temperature – and that helps to form the foundation of CalHeatScore,” said Wieland. “Each of these rankings, zero to four, are directly based upon increased risk of emergency department visitation rates from extreme heat.”
Calculating Health Risk
While extreme heat affects everyone, there are numerous groups that are disproportionately impacted by extreme heat, explained Wieland. Those include the very young, the elderly, those whose jobs require them to work outdoors, and individuals who are medically uninsured.
Symptoms of extreme heat can range from mild to life-threatening, including heat exhaustion, heat stroke and kidney failure. The most serious of which are extreme medical emergencies which require a trip to an emergency room for immediate treatment.
In the state of California, emergency departments of hospitals submit their records data to the California Department of Healthcare Access and Information. After a lengthy process designed to protect HIPAA confidentiality and data security, OEHHA was granted access to the health data to help inform CalHeatScore’s rankings. The state-level dataset – as opposed to national Centers for Disease Control and Prevention (CDC) data – provides a greater level of granularity for OEHHA to map out occurrences of heat related illness by zip code. This is essential in sprawling counties, like Los Angeles, to see the details of emergency department visitations per community because there is a lot of heterogeneity across the county in regards to health response, explained Wieland.
“The purpose of the tool is to reduce heat-related illnesses and save lives by translating all this complex [weather] data into alerts for people to get a sense of the dangers of extreme heat specific to their community and also understand what they can do to take action,” said Wieland.
A key component of CalHeatScore is not only being a tool that characterizes heat risk at the community level but also connecting residents to a local level of resources for extreme heat mitigations. Wieland’s team at OEHHA has begun this work by mapping out the locations of cooling centers throughout the state. As cooling centers are maintained by cities and counties, instead of the state, this work requires having a close relationship with local governments. This ensures they have the same, accurate information about the availability of cooling centers so residents can access those resources in the time of need, explained Wieland.
Future iterations of CalHeatScore will map additional local statewide resources, such as urban heat island effect, and tree canopy.
Next Steps
As this is the first summer CalHeatScore has been in use, Wieland emphasizes that the tool is very much in its initial phases. OEHHA will be adding supplementary health data to further inform the heat rankings as well as improved features for usability as they observe how CalHeatScore performs to the public in its first iteration.
One of the priority improvements is increasing its accessibility for all Californians. “This is so important because we want people to get notified when there is an extreme heat event,” said Wieland. “Right now, we are exploring the path of developing a mobile application, and we view this development as part of a broader suite of approaches to reach Californians where they are that include other media options such as local news, embedding in trusted sources people are already using, and leveraging established state pathways for providing public health and safety alerts.”
For accessibility and given California’s diverse population, OEHHA plans to translate CalHeatScore into multiple languages in addition to its current availability in English and Spanish. Furthermore, OEHHA plans to incorporate heat-related mortality data as well as look at the chronic health impacts of heat, such as exacerbating underlying illnesses like cardiovascular disease, diabetes, or respiratory illnesses – from California emergency department data for a more holistic heat warning tool.
To do all this and more, Wieland emphasized collaboration and additional perspectives as the keys to making CalHeatScore a valuable tool for all Californians. “We really need to hear from community members, local governments, community-based organizations and others about what we should be prioritizing with CalHeatScore,” he said,“We don’t want to operate within a vacuum. The OEHHA team aims to do robust community engagement with with groups like tribes, workers, and labor organizations among others, to ask, ‘What should we be focusing on for CalHeatScore to make it more accurate and more user friendly?’”
Wieland visualizes this process as an iterative feedback loop where OEHHA receives input, makes improvements, and then trials the improvements with Californian communities to assess effectiveness. “We're a public health and risk assessment based agency building this science-based tool that's positioned to protect California's most vulnerable,” he said.
About the Author
Stefanie Le

Stefanie Le is a writer for Data-Smart City Solutions. She previously worked at the Washington Post, the Ash Center for Democratic Governance and Innovation at Harvard, the Information Disorder Lab at the Shorenstein Center on Media, Politics and Public Policy, the International Criminal Court, and The Boston Globe. Stefanie holds two master’s degrees from the UC Berkeley Graduate School of Journalism (2018) and Harvard University (2016), where she specialized in international law and investigative reporting, and international relations respectively, and bachelor’s degrees in journalism and English literature from Emerson College.