


Map Monday: LA Public Safety
Map: Public Safety - Community-Level Analytics
Geographic Area: City of Los Angeles, California
Year Published: 2022
Goal: To provide clear and accurate information about crimes in LA neighborhoods.
Datasets: LAPD crime data coupled with LA County Department of Public Health maps
Complementing Harvard’s Map of the Month series, Map Monday highlights a data visualization that enhances understanding of or helps resolve a critical civic issue.
According to multiple national surveys, crime rates are one of the most pressing concerns for Americans, a concern that has been rising over the past several years. But has crime actually increased at the same rate as worry about crime? And, can residents find reliable statistics on changes in crime rates, victim demographics, and if the pandemic impacted crime trends?
In October 2022, the city of Los Angeles’s Data Team worked with researchers from California State University to publish an interactive crime data visualization tool so that residents could better see and understand crime trends in their communities. One of the major reasons they developed this tool was the November 2022 mayoral elections; across the country, crime rates are identified as a very important voting issue. However, it can be difficult to find reliable data — and even more difficult to parse through it.
In order to create truly open data that would provide a trustworthy and digestible view of LA crime rates, the city’s Data Team pulled data on reported crimes from 2010 to 2022. Rather than simply report on recent crime rates, the team wanted to share trend data for a decade-plus of incidents. The team used two main datasets, one with information from 2010 to 2019 and the second with data from 2020 to July 2022. Together these datasets had a repository of 2.6 million reported incidents.
The crime datasets came from the Los Angeles Police Department (LAPD), and are organized with information like year and date, case status, weapons present (if any), and the “street address of crime incident rounded to the nearest hundred block to maintain anonymity.” This categorization is different from other city datasets, particularly when it comes to location. In addition to preserving anonymity by rounding blocks, the LAPD breaks down the city by Patrol Divisions that correspond to community police stations. Since these aren’t well recognized by most Angelenos, the Data Team “geocoded all records and assigned each crime incident to their corresponding LA County Department of Public Health neighborhood designations.” This made it much easier to identify localized trends with other statistical and demographic information previously collected by the city.
Once the city had collated and geographically organized the data, the CalState team ran statistical analyses on the information. Led by Professor Jie Zhong, the students and researchers focused on Part 1 crimes, which “are considered to be more serious, violent crimes (such as homicide, arson, vehicle theft).” Narrowing this focus brought the number of incidents being analyzed from 2.6 million to 1.4 million; they also focused on 2010 to 2021 since the 2022 dataset had only six months of information.
They found a slight increase in Part 1 crimes in those 11 years, from 289.5 to 303 crimes per 10,000 residents (a change of roughly +1,000/year). The team also broke down crime rates by community, gender demographics in crime victims, trends over time of victim racial identity, and increases/decreases in crime by neighborhood. Professor Zhong and his students wrote about these findings, including their additional research specific to homicides, on the city’s DataLA blog.
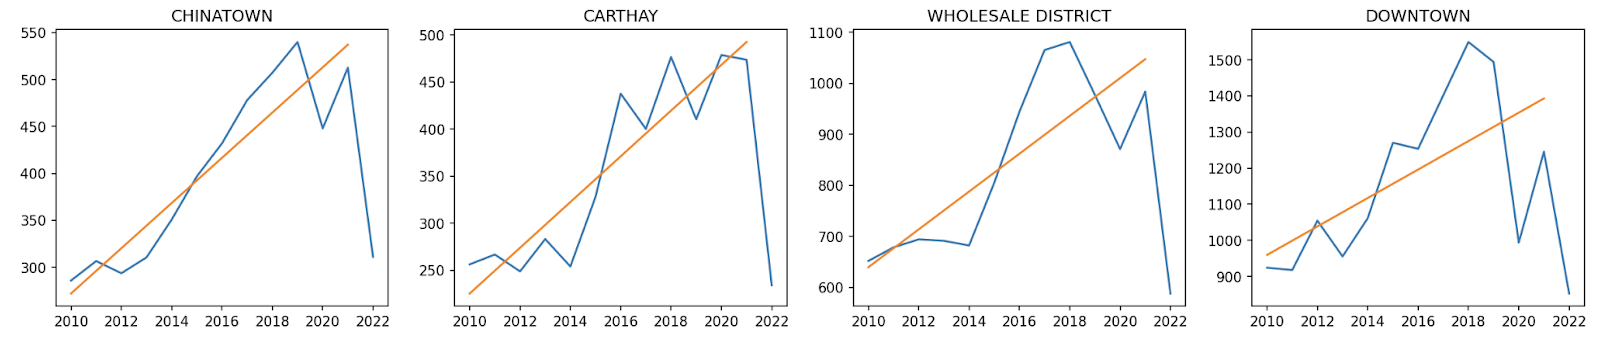
However, the linear regression models and other charts are static depictions and aren’t as accessible for lay audiences. So the Data Team and researchers worked together to build a full map application to visualize the rate (increase/decrease) of neighborhood crimes since 2010. Additionally, the map is able to pull up-to-date statistics as yearly data becomes available.

Starting with a map of LA, users can quickly see crime rates with orange areas showing an increase in neighborhood crime rates and the blue showing a decrease, with opacity indicating the intensity of change since 2010. Police and fire station locations are also indicated on the map. Users can then zoom in to neighborhood designations or specific addresses to see both the top three types of crimes reported (which aren’t necessarily Part 1 crimes) and the specific Part 1 crime analytics.
During an earlier interview with Data-Smart, LA’s Chief Data Officer Eva Periera discussed the importance of disaggregating data and sharing insights across departments. This map is a prime example of why transparent data is important for community members and city officials alike, and why disaggregating data is a more equitable and insightful way of analyzing information.
About the Author
Betsy Gardner

Betsy Gardner is the editor of Data-Smart City Solutions and the producer of the Data-Smart City Pod. Prior to this, Betsy worked in a variety of roles in higher education, focusing on deconstructing racial and gender inequality through research, writing, and facilitation. She also researched government spending and transparency at the Lincoln Institute of Land Policy. Betsy holds a master’s degree in Urban and Regional Policy from Northeastern University, a bachelor’s degree in Art History from Boston University, and a graduate certificate in Digital Storytelling from the Harvard Extension School.