


Longmont, CO: Building a Better Climate Future with Maps
On October 8, 2019, the Longmont, CO City Council declared a climate emergency, unanimously passing a resident-initiated Climate Emergency Resolution. Building on community advocacy and interest, this resolution turbo charged sustainability and climate work on the city level and led to the development of a Climate Action Task Force. Composed of residents, city staff members, technical advisors, and representatives from the business and education community, the group focused on building a resilient community that can prepare for, react to, and recover from climate change. Alongside the Task Force, the Just Transition Plan Committee, a group of frontline community members also convened by city staff, developed equity recommendations to be applied to climate action recommendations. Together, the work of these two groups comprise the city’s Climate Action Recommendations Report, which was approved by the Longmont City Council in July of 2020.
According to the city’s Sustainability Manager Lisa Knoblauch, who coordinated and convened the Task Force, much of the past climate work was centered on mitigation. And while that long-term vision was important, residents were already facing the impacts of climate change, which pushed the group to include a focus on adaptation and resilience. “Looking at how to accelerate our work around climate change,” said Knoblauch “really surfaced the need to focus more on the adaptation and resilience component and do that through an equity lens.”
Given her background working on sustainable community development projects, Knoblauch was already used to working closely with the city’s Community and Neighborhood Resources division, making sure that the Sustainability Office's work was rooted in community and community needs. This was also an important factor for the Task Force, as the members decided to prioritize understanding the public health impacts of climate change. One of the first steps in doing that was to conduct a climate risk assessment to understand what climate risks the community was actually facing. And, perhaps most importantly, understand where those climate risks were felt unequally. “We know that not everybody is impacted in the same way,” said Knoblauch, “And we wanted to really understand who is most impacted and what factors are influencing that.” Establishing a baseline and having leaders working from the same page would then allow staff to move forward and address those issues; according to Knoblauch, they decided to do this with a mapping tool because of the power of the visual format.
Building the Team
Knoblauch has been with the city of Longmont nearly a decade but is currently working in the newer Department of Strategic Integration, founded three years ago to help support broader organizational alignment around city council priorities and goals. Conveniently, the city’s geographic information system (GIS) team is housed in the same department, along with data and analytics teams. Enter Eric O’Brien, Longmont’s GIS manager, who was able to serve as a technical advisor as the data visualization work began on the Climate Risk Mapping Tool. According to O’Brien, whose department acts as internal support for fellow city “customers,” his role was to look at everything from reviewing the scope of work to what technology should be used to helping draft requests for proposals (RFPs). Thanks to the structure of Longmont’s government that places GIS in a central space with other cross-agency offices, connecting on this project and getting from ideation to RFP was streamlined.
The RFP went out in April 2021 and by June 2021 the organization RTI International was selected to co-develop the data visualization tool. One of their first pieces of work was to conduct a literature review to look at how other cities had developed climate risk scores based on different hazards and determine what should be analyzed to create a risk score for dangers like extreme heat, poor air quality, or flooding. This review led the RTI team to recommend looking at data beyond economic, social, housing and health vulnerability – which Knoblauch described as standard – and to look at infrastructure characteristics like impervious ground surfaces and building stock.
RTI also had to consider the unique temperature variabilities of Longmont; both extreme heat and extreme cold are concerns. There was also a significant focus on environmental hazards, in particular air pollution.

Building the Tool
Once Knoblauch and the RTI team, led by engineer Diane Bridger, established metrics it was time to gather all the data together. This required bringing together information from the Planning Department, Neighborhood Resources team, folks from Longmont Power and Communications, the Forestry and wildfire experts, and engineers to help inform key pieces. By uniting massive amounts of data into a single visual tool, RTI was able to bring together insights from members of the city who may not have connected their data before.
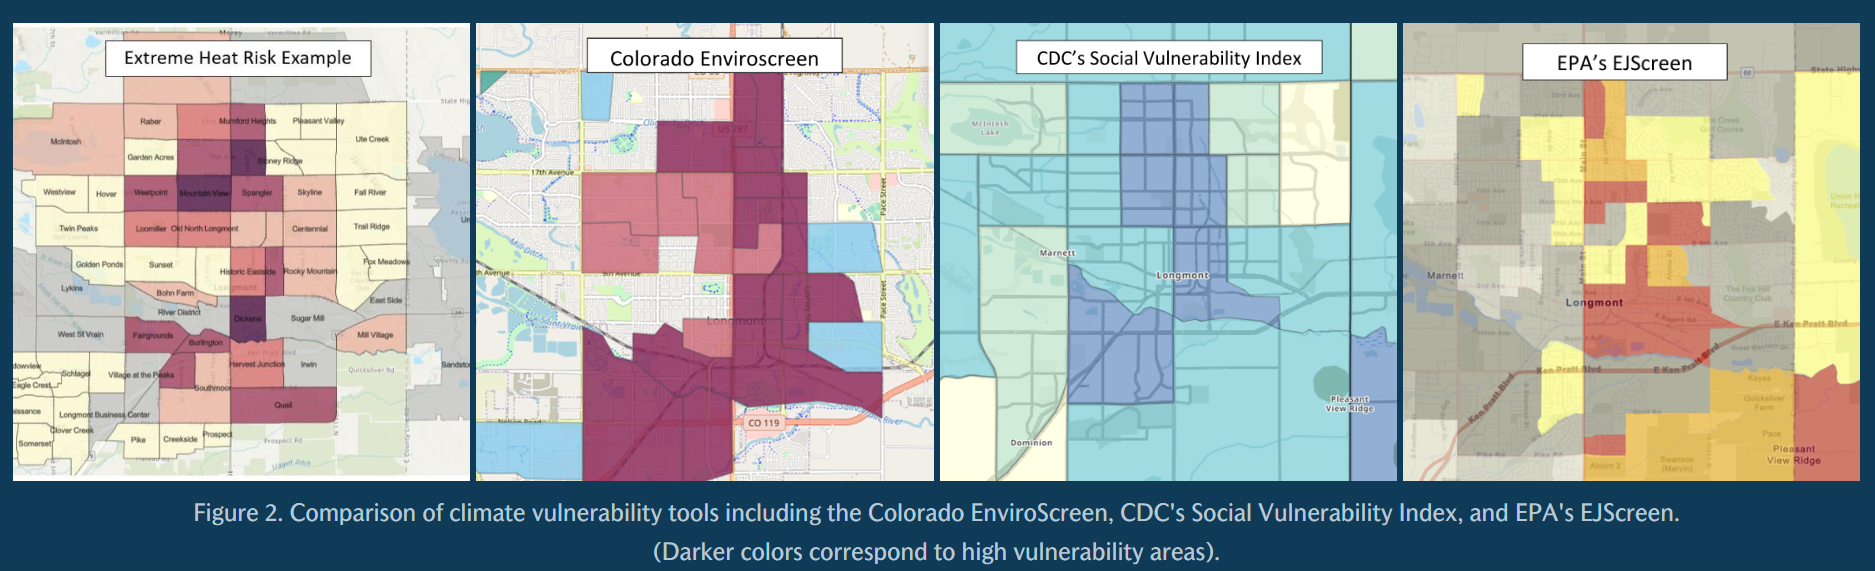
Initially, the tool was a large interactive map; Knoblauch and the RTI team brought in a community group to test the tool and offer feedback. This group, the Equitable Climate Action Team (ECAT; formerly the Just Transition Plan Committee), is a city-led group of frontline community members “who volunteer their time and lived experiences to help the city understand the equity implications” of climate work, according to Knoblauch. This community engagement was critical, as the ECAT members identified several issues with the useability. One large map wasn’t easy to understand, nor was it intuitive for non-technical users. Additionally, folks from ECAT wanted to see more stories from the community and asked that the data be more humanized. City representatives also did presentations to the Neighborhood Group Leaders Association, an organization that comprises nearly 60 registered neighborhood groups.
From this feedback, the team went back to the user interface and design and developed a StoryMap in ArcGIS in addition to the interactive map. Now, individual stories are incorporated with the technical aspects, there are easy-to-understand instructions, and videos explaining how to use the StoryMap.
Building a Better Future
Over the last few months Knoblauch and her team have been doing “internal roadshows” with other city staff to introduce their work and show how the tool can be used across different departments. “That's really the purpose of [the tool],” said Knoblauch, “we want people to use it to take action” She’s currently working with transportation and public art staff to overlay transit infrastructure and extreme heat maps to determine where to place art-based shaded bus stops that can provide shelter, beautification, and education.
Both Knoblauch and O’Brien shared tips for other city leaders, hoping to use their experience to inspire other local governments:
“One of the big things that helped it be successful” was bringing in enterprise GIS at the very beginning of the project, said Knoblauch. While their department organization helps facilitate that close connection, others should start this work by identifying GIS and data folks within their city and engaging them right away.
Plan for a hand-off and have the tool set up so that the city can run it. In addition to helping in the early project planning and hiring stages, O’Brien’s team made sure that the hand off from RTI was straightforward and the city could maintain the tool.
In a resource-constrained environment, investing in a GIS tool helps target funding and resources appropriately. Through the Boulder County sustainability matching grant program, Longmont received funding that Knoblauch utilized to build out the tool. However, she acknowledged that generally “Longmont is pretty resource constrained,” so a tool like this helps the city get the biggest return on their investments – plus, it doesn’t put the burden on those impacted communities to ask for funds or know how to get access to grants.
Have good partners. In addition to O’Brien’s team, Knoblauch gave a lot of credit to Bridger and the RTI team, as they had a very collaborative relationship. Additionally, Longmont residents were an important partner; summing up that relationship, Knoblauch reiterated that the work is on the city, informed by the community.
About the Author
Betsy Gardner

Betsy Gardner is the editor of Data-Smart City Solutions and the producer of the Data-Smart City Pod. Prior to this, Betsy worked in a variety of roles in higher education, focusing on deconstructing racial and gender inequality through research, writing, and facilitation. She also researched government spending and transparency at the Lincoln Institute of Land Policy. Betsy holds a master’s degree in Urban and Regional Policy from Northeastern University, a bachelor’s degree in Art History from Boston University, and a graduate certificate in Digital Storytelling from the Harvard Extension School.